Revealing Hidden
Asphalt Variability at
Toowoomba Velodrome
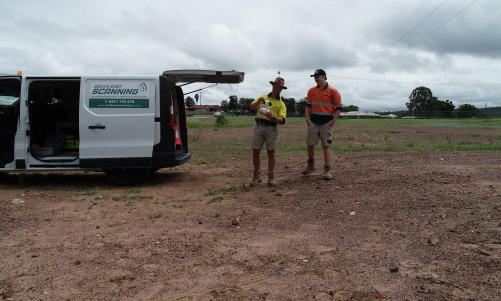
When NTRO needed a clear understanding of asphalt thickness across the Toowoomba Velodrome, South-East Scanning delivered a non-destructive GPR approach — mapping four lanes continuously without a single core drill through the track.
The Project
When the National Transport Research Organisation (NTRO) needed a clear understanding of asphalt thickness across the Toowoomba Velodrome, they faced a familiar challenge — how do you assess what sits beneath the surface without core drilling? South-East Scanning was engaged to undertake longitudinal Ground Penetrating Radar surveys across four lanes of the velodrome track.
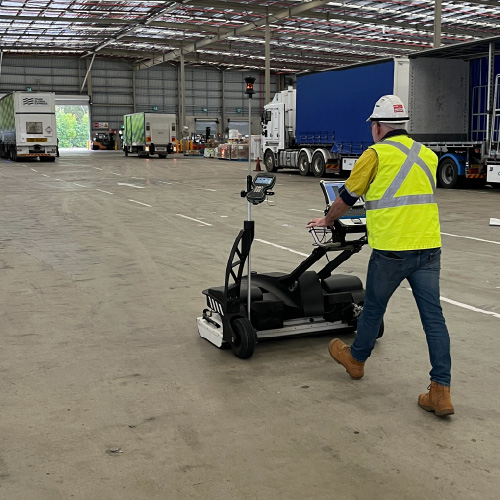
The survey used a high-frequency GPR system, the Proceq GP8000, to collect continuous scan data along approximately 330 metres of each lane, recording thickness measurements at 10 metre intervals. A dielectric constant of 6.0 was applied consistently across all lanes for depth conversion. Four continuous longitudinal scan lines were collected, generating a total of 1,320 interpreted thickness points across the velodrome.
The objective sounded simple — measure asphalt thickness across four lanes. In practice, the surface told a very different story.
What the Data Revealed
What stood out early was the level of variability — not minor differences, but significant shifts from one section to another. In some areas, asphalt measured as thin as 60 mm, while nearby sections reached up to 129 mm. That kind of variation rarely happens by chance. It typically reflects how the track was originally constructed, with layers placed at different times or under varying conditions.
Across all four lanes, no consistent pattern in thickness was observed. Rather than gradually increasing or decreasing, thickness fluctuated throughout the track. Some sections showed sudden increases, while others thinned out just as quickly. This type of variation points to construction variability rather than long-term wear.
Lane-by-Lane Results
Longitudinal thickness interpretation was completed at nominal 10 m chainage intervals across approximately 330 m of track length for each of the four surveyed lanes.
| Lane | Character | Variability | Core Validation |
|---|---|---|---|
| Inner Lane | Consistent fluctuation, no uniform zones | Moderate | — |
| Inner-Centre Lane | Greatest variability; layered construction confirmed | High | 60–129 mm |
| Outer-Centre Lane | Distributed variability; no concentrated defect zone | Moderate | — |
| Outer Lane | Consistent with other lanes; no progressive trend | Moderate | — |
How We Interpreted the Data
GPR is not just about collecting data — it requires interpretation. In clearer areas, reflection signals made it relatively easy to identify the base of the asphalt layer. In other sections, signals were weaker or slightly distorted. Rather than over-interpreting uncertain data, the team applied consistent interpretation criteria, focusing on the earliest reliable reflection rather than chasing deeper, less certain signals. This helped avoid overestimating thickness in more complex areas.
Thickness interpretation targeted total asphalt thickness using a three-peak reflection identification protocol: the first small amplitude response was identified as time zero; the second reflection peak was interpreted as the base of the upper asphalt layer; and the onset of the third reflection peak was consistently selected to represent the total asphalt base. This picking approach was applied uniformly across all 330 chainage positions per lane.
Surface cracking and minor irregularities also influenced signal clarity, requiring small positional adjustments — within ±100 to ±200 mm — during scanning to maintain accuracy. These adjustments did not materially affect the interpretation of the longitudinal trend.
Core Validation
To support the findings, physical core samples were taken — primarily from the Inner-Centre Lane. These cores confirmed what the GPR data indicated: the asphalt structure was not uniform and, in some cases, showed signs of layered construction, with segments separating during extraction. Differences between core results and GPR readings were expected and reflected real-world variability, particularly as cores were not taken directly on the scan lines.
Core thicknesses ranged from 60 mm to 129 mm, demonstrating substantial localised variability. The Chainage 200–204 m region showed the largest discrepancy between core and GPR-derived values. Given that the core locations were offset laterally from the scan line, this is interpreted as spatial construction variability rather than a systematic calibration error.
Comparison between core thickness and GPR-derived thickness indicates that differences are dominated by localised structural variability and lateral position effects rather than by systematic calibration error. The mean absolute difference was approximately 21 mm.
The Outcome
This is where the real value of the approach became clear. Traditional coring provides isolated data points — useful, but limited. GPR, on the other hand, delivered a continuous thickness profile across the entire velodrome. Instead of guessing what happens between core locations, the client could see the full picture, including the inconsistencies that would otherwise go unnoticed.
By the end of the project, NTRO had more than just measurements. They had a detailed, continuous dataset to support maintenance planning, identify risk areas, and make informed decisions with confidence.
- 1,320 thickness data points generated across all four lanes at 10 m intervals
- Full continuous longitudinal thickness profile — not possible with coring alone
- Inner-Centre Lane variability (60–129 mm) confirmed and independently validated by cores
- Layered asphalt construction identified through both GPR data and core separation
- Risk zones and thickening pockets identified for targeted maintenance planning
- No track closures or structural damage required to complete the survey