Winch-Deployed 160MHz Radar
On A 30 Degree
Geomembrane-Lined Slope
Winch-deployed 160MHz radar on a 30 degree geomembrane-lined slope, with volumetric void modelling in Geolitix.
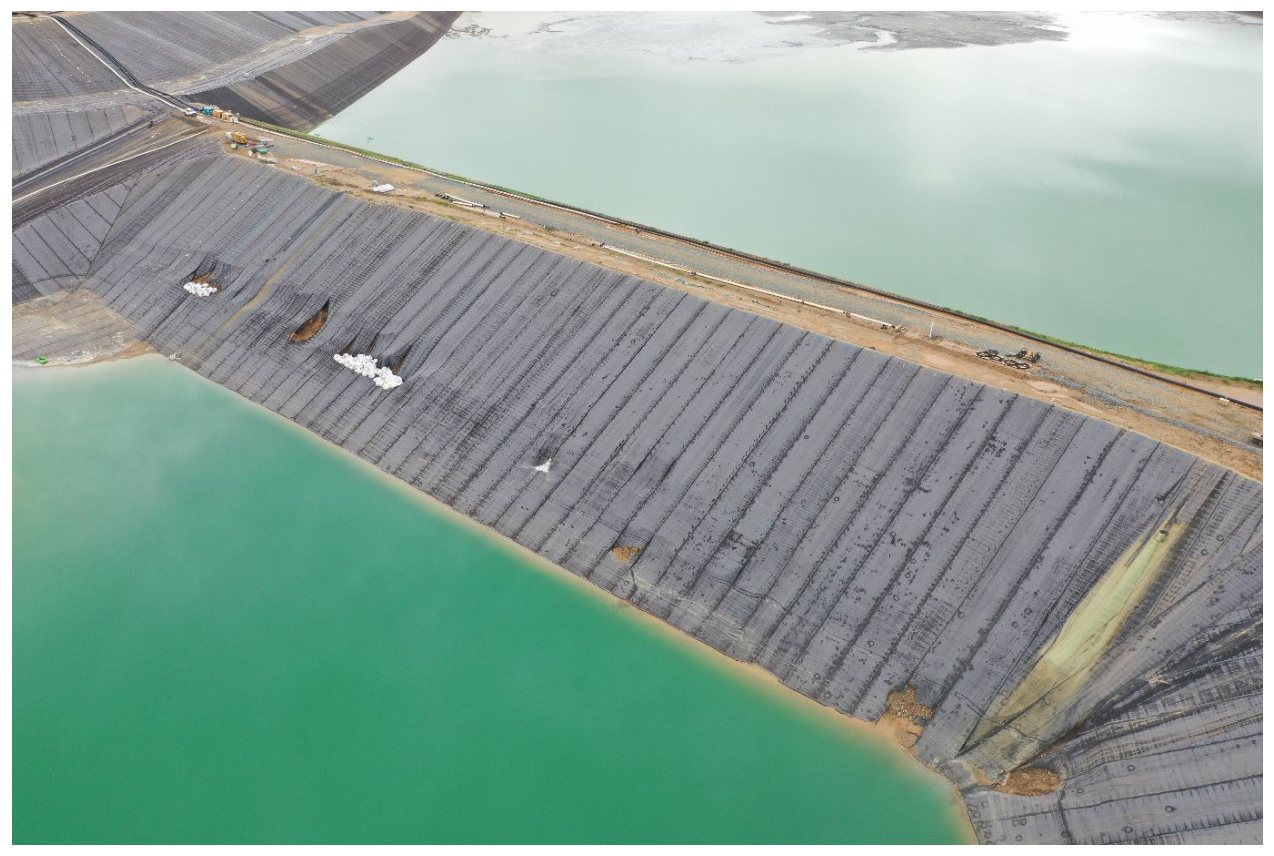
The surveyed structure: a lined tailings dam embankment with visible degradation to the geomembrane face.
The Brief
A mine operator engaged us to investigate a section of a lined tailings dam embankment where surface degradation had become visible on the geomembrane face. Sections of the liner had torn and slumped, and fill material had emerged at the toe. The operator needed to know whether the damage was confined to the surface, or whether material loss had already occurred within the embankment behind the liner.
Answering that question by excavation was not a realistic option. The liner is the containment system for the facility, and any intrusive investigation into a suspect section of embankment introduces its own risk, both to the structure and to the people carrying it out. The question was therefore well suited to a geophysical approach, provided the survey could be delivered without placing personnel on an unstable 30 degree slope.
Why The Asset Was Difficult
Tailings embankments are among the more demanding environments for ground penetrating radar. Several conditions worked against the survey at once:
Each of these individually is manageable. Together, they meant that the standard approach of walking a gridded survey with survey-grade positioning was not available, and a different method had to be built for the site.
Methodology
Before Mobilisation
Project scoping and risk assessment were undertaken jointly with the asset owner to define objectives, access requirements, and safety controls. A Job Safety Environmental Analysis was developed covering cyanide and caustic exposure, steep terrain, and heat stress. All site permits were obtained before travel.
The 160MHz radar system was inspected, calibrated, and fitted with a skid plate to maintain ground coupling across an irregular surface. Supporting equipment was staged for operational readiness, including the winch system, an anchor block and fall-arrest systems, PPE, and emergency response kits.
The Winch-Assisted Deployment
This was the element of the job that made the survey possible at all. Rather than walking the antenna across the face, the radar sled was lowered down the embankment on a winch and safety rope system operated from the crest. No personnel stood on the embankment at any point during data acquisition.
The crew worked within a defined exclusion zone and maintained continuous radio communication throughout, so that sled movement could be controlled precisely, equipment strain avoided, and the sled steered clear of the collapsed sections where recovery would have been difficult or impossible.
The winch method converts a task that would otherwise be refused on safety grounds into a controlled, repeatable operation. It also produces straighter, more consistent scan lines than a person could walk on a 30 degree face, which improves the quality of the resulting grid.
Positioning Without Survey Control
With no RTK correction available, position had to be established manually. Increments of 750mm were measured and marked along the crest of the embankment wall to set the start of each scan line. An approximate position was recorded using the internal GPS of the control tablet, and this was then corrected against survey control data supplied by the site survey team. The resulting positional tolerance is approximately 1 to 1.5m, which is stated plainly in every deliverable.
Coverage And Quality Control
The survey scope was revised on site, in consultation with the asset owner, to concentrate on the two areas where visible surface degradation and potential subgrade change were the priority concerns. A line spacing of 750mm was adopted for these areas to maximise resolution within the operating window that the weather allowed. Real-time visualisation was used on site to confirm data quality and adequate coverage before demobilisation.
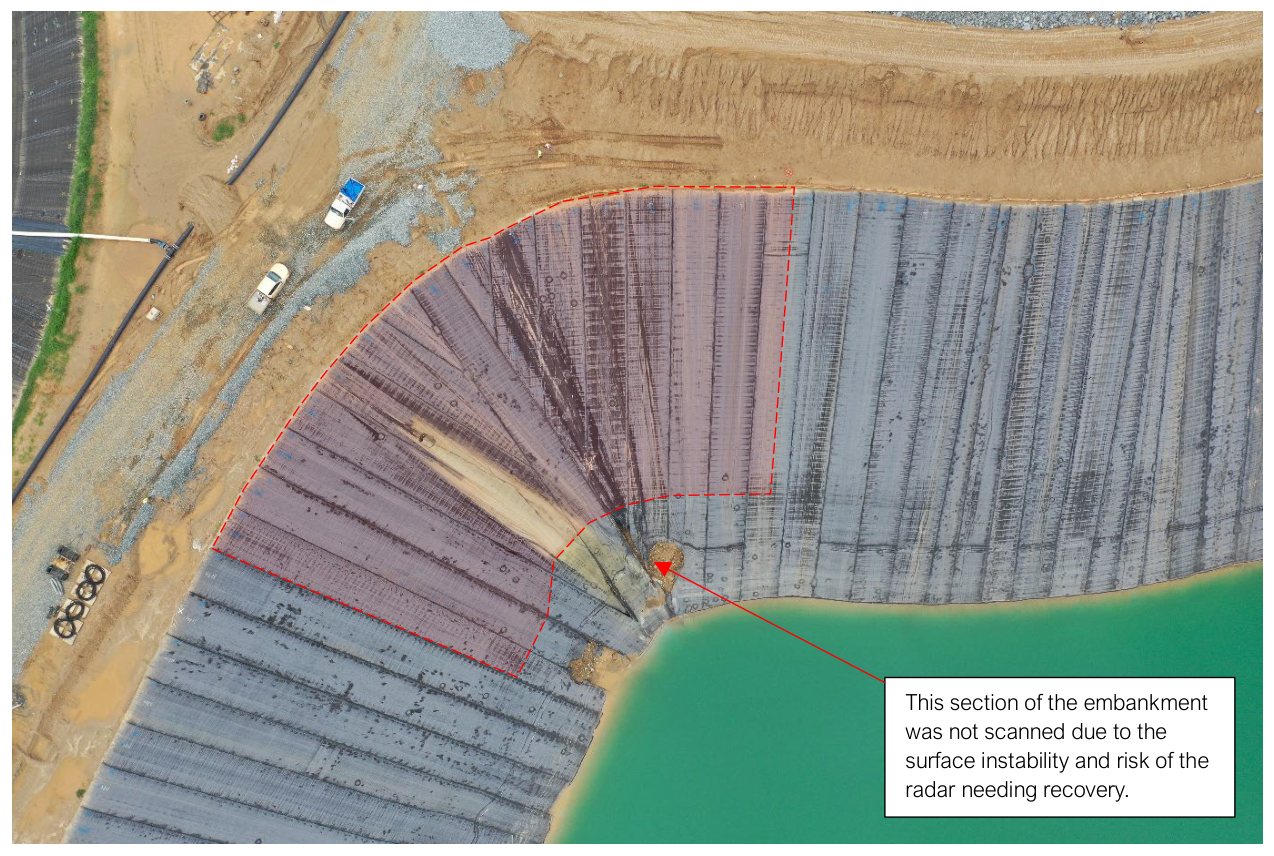 Figure 1
Figure 1: the revised survey extent. The annotated section was excluded on safety grounds, given surface instability and the risk of the radar requiring recovery.
Site Conditions And Challenges
Rainfall And Access
- Over 150mm of rainfall produced severe runoff across the embankment, affecting access and delaying operations.
- The principal contractor redirected resources to other critical repair works, which required scanning activities to be rescheduled.
- Returning to camp early and waiting for workable conditions was the correct call, and it protected both data quality and crew safety.
Water Infiltration Into Decomposed Granite
- High moisture content altered the dielectric properties of the subsurface materials and reduced radar penetration depth.
- Water retention varied across the surveyed area, introducing inconsistencies that required additional processing to compensate for.
Slope And Operational Safety
- The 30 degree slope presented obvious difficulties for equipment stability and operator movement.
- Severely degraded sections carried a genuine risk of the radar system dropping into a collapsed void.
- Boulders and other protrusions made complete coverage of the nominated scanning area impossible.
Positioning And Equipment Range
- A GPS fix could not be established without a connection to the site base station, and attempts to connect the rover were unsuccessful despite assistance from the site survey team.
- The maximum working distance between the radar and the control tablet is approximately 30m, which limited the length of some individual scan lines.
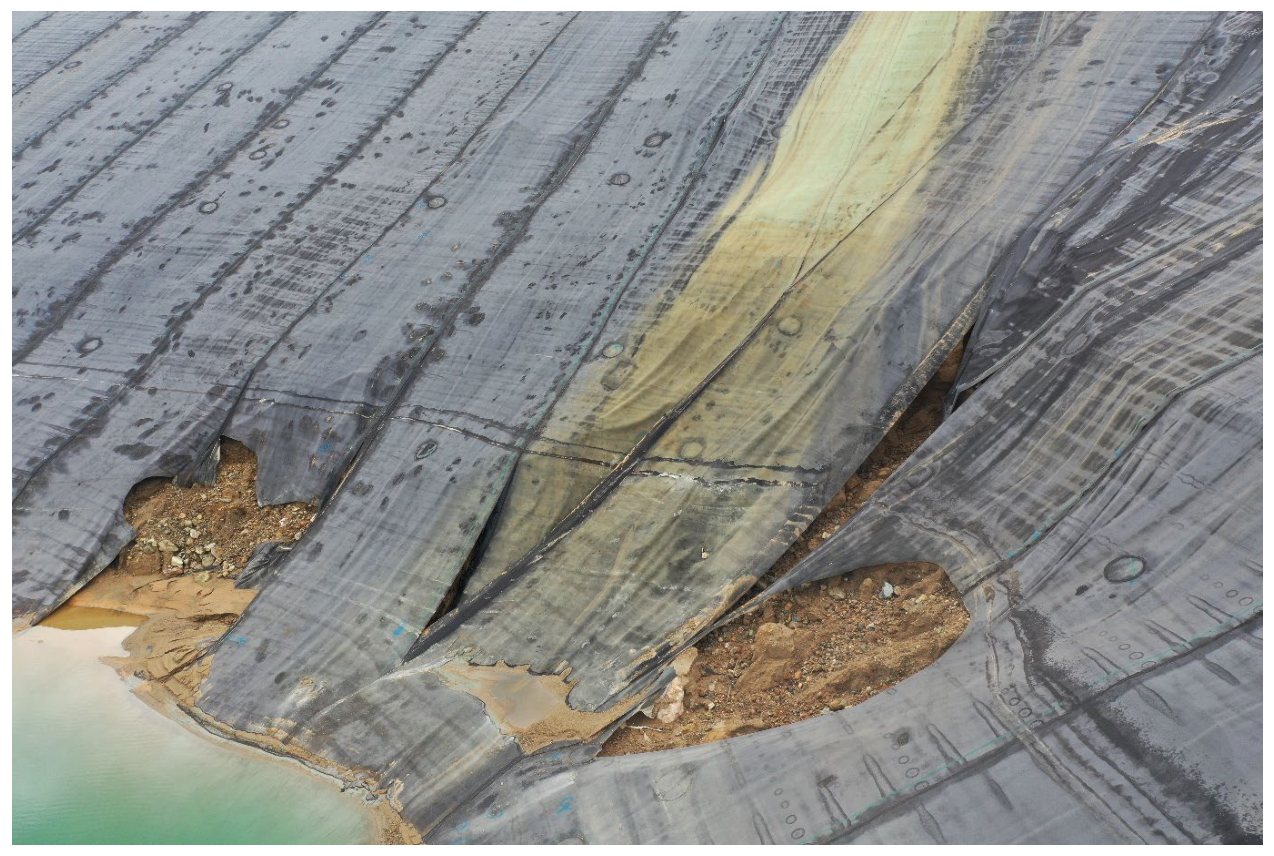 Figure 2
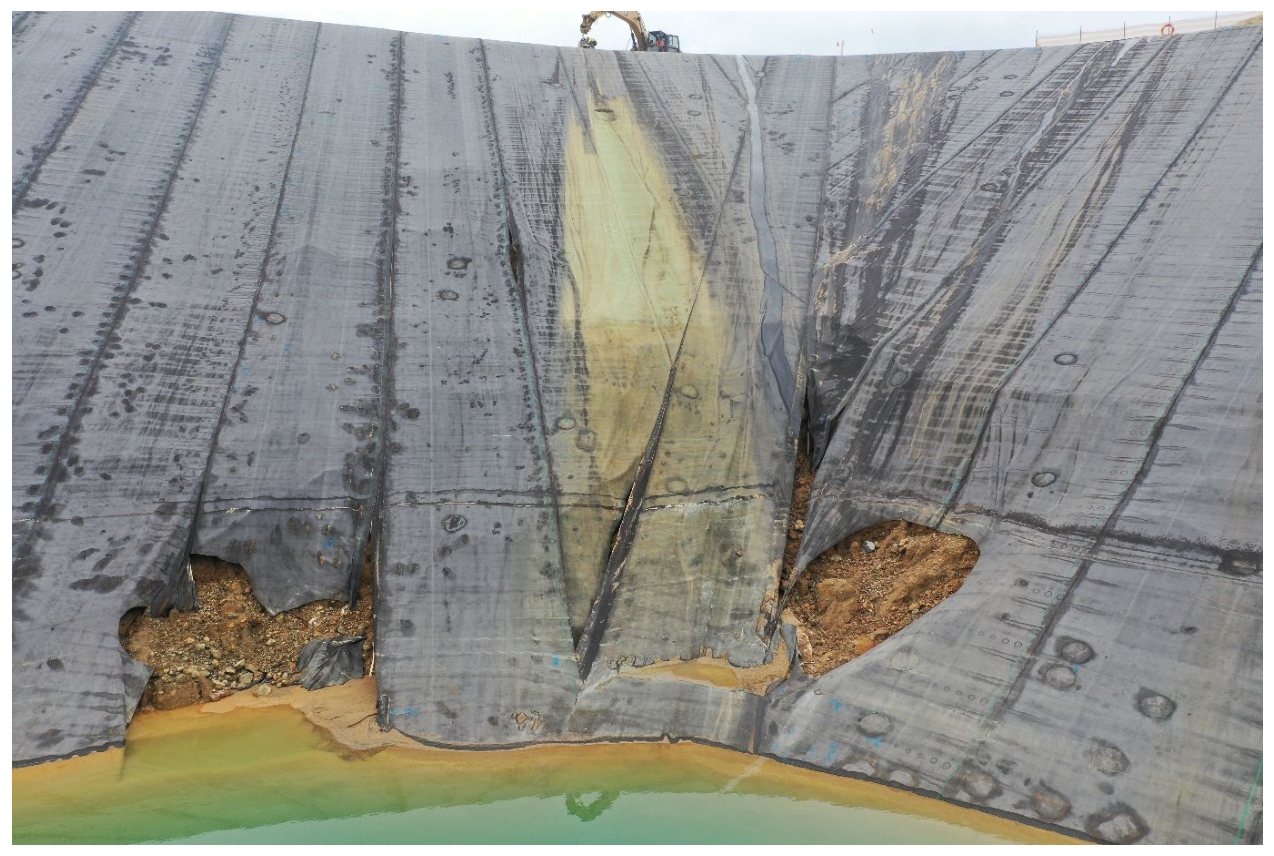 Figure 4
Figure 2: degradation at the toe of the embankment, with liner tearing and exposed fill material. Figure 4: close-up of liner failure and displaced fill within the surveyed area.
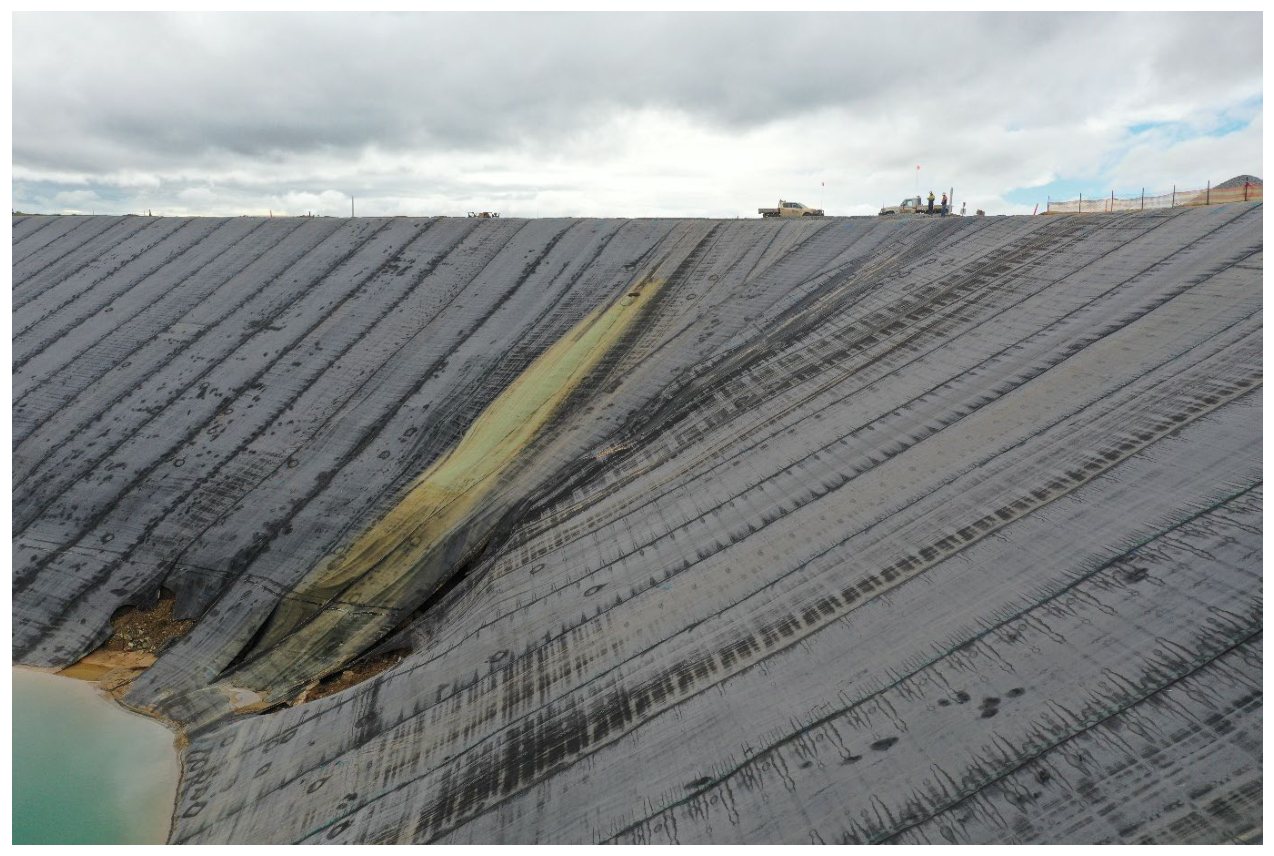 Figure 3
Figure 3: the surveyed section viewed from the toe, showing the slope angle the radar had to be worked across.
Dielectric Properties And Depth Calibration
The dielectric constant of a material governs radar wave velocity and, in turn, penetration depth. Low dielectric materials such as air or dry sand allow faster propagation and deeper penetration, while high dielectric materials such as wet sand or freshwater slow the wave, increase attenuation, and reduce the depth achievable.
On this site, the decomposed granite and bulk waste rock fill offered moderate penetration, but both were affected by moisture retention, which raised their effective dielectric values and reduced radar performance. The bituminous geomembrane produced a strong reflection because of its contrast with the material behind it, making interpretation beneath that layer more demanding. Establishing realistic dielectric values for each material was therefore essential to calibrating depth and to mapping subgrade change with any confidence.
| Material | Dielectric Constant |
|---|---|
| Air | 1.0 |
| Dry sand | 3.0 to 5.0 |
| Wet sand | 20.0 to 30.0 |
| Decomposed granite | 4.0 to 7.0 |
| Clay | 10.0 to 20.0 |
| Freshwater | 80.0 |
| Bituminous geomembrane | 2.5 to 4.0 |
| Bulk waste rock fill | 5.0 to 8.0 |
Data Processing In Geolitix
Geolitix is a GPR data processing platform built for large survey datasets. It supports real-time radargram visualisation for data quality assessment, automated filtering and noise reduction, 3D subsurface modelling for cross-sectional interpretation, and multi-format export, including CSV, DXF, GRD, KMZ, REFLEX, SGY, and Shapefile, for integration with geotechnical and GIS packages.
Processing Workflow
- Raw data import: the field data from the 160MHz system was uploaded into Geolitix.
- Filtering and noise reduction: gain adjustment and frequency filtering minimised high-moisture artefacts and interference.
- Depth calibration: velocities were adjusted to account for the dielectric shift caused by moisture retention in the decomposed granite.
- Layer detection and anomaly identification: automated and manual interpretation were combined to map subsurface features.
- 3D modelling and analysis: depth slices and cross-sectional visualisations were generated to assess embankment integrity.
The platform also allowed an interactive data viewer to be issued to the asset owner, so that the survey outcome was not confined to a static report. Stakeholders can rotate the isosurface model, step through depth slices, and interrogate individual profiles themselves, which is a meaningful improvement over a set of printed figures when several disciplines need to look at the same data.
Results
A total of 96 datasets were collected across the revised extent. After processing, these produced the following outcomes:
A Geolitix calculation of the processed data returned an indicative void signature totalling approximately 327m² across the surveyed area. Strong radar reflections in specific zones are indicative, by observation, of subsurface anomalies, including possible voids or changes in material composition. The data suggests potential voids, and intrusive verification is recommended to confirm their presence and extent.
- Anomalies were identified at depth that are not expressed at shallower levels, which is significant for an embankment where surface condition alone was driving the assessment.
- An interactive 3D data viewer was issued alongside the report, giving the asset owner access to isosurface models, GPR profiles, and depth slices.
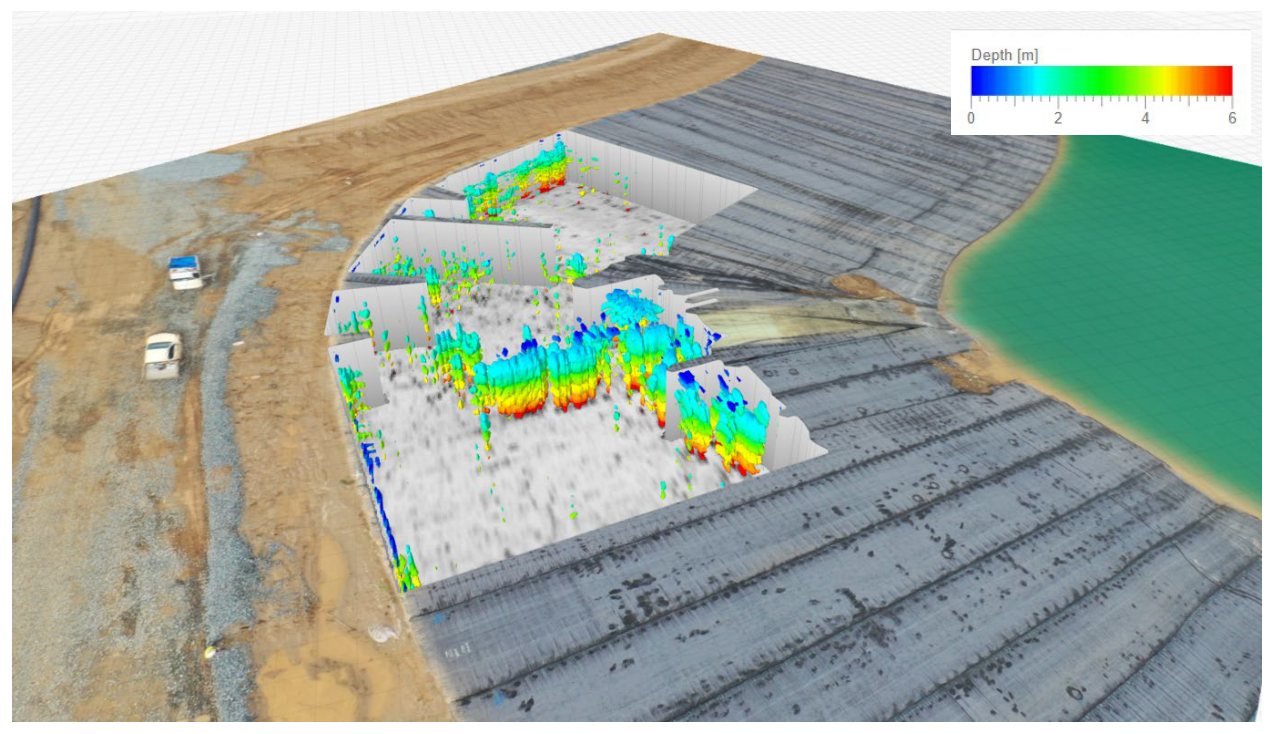 Figure 5
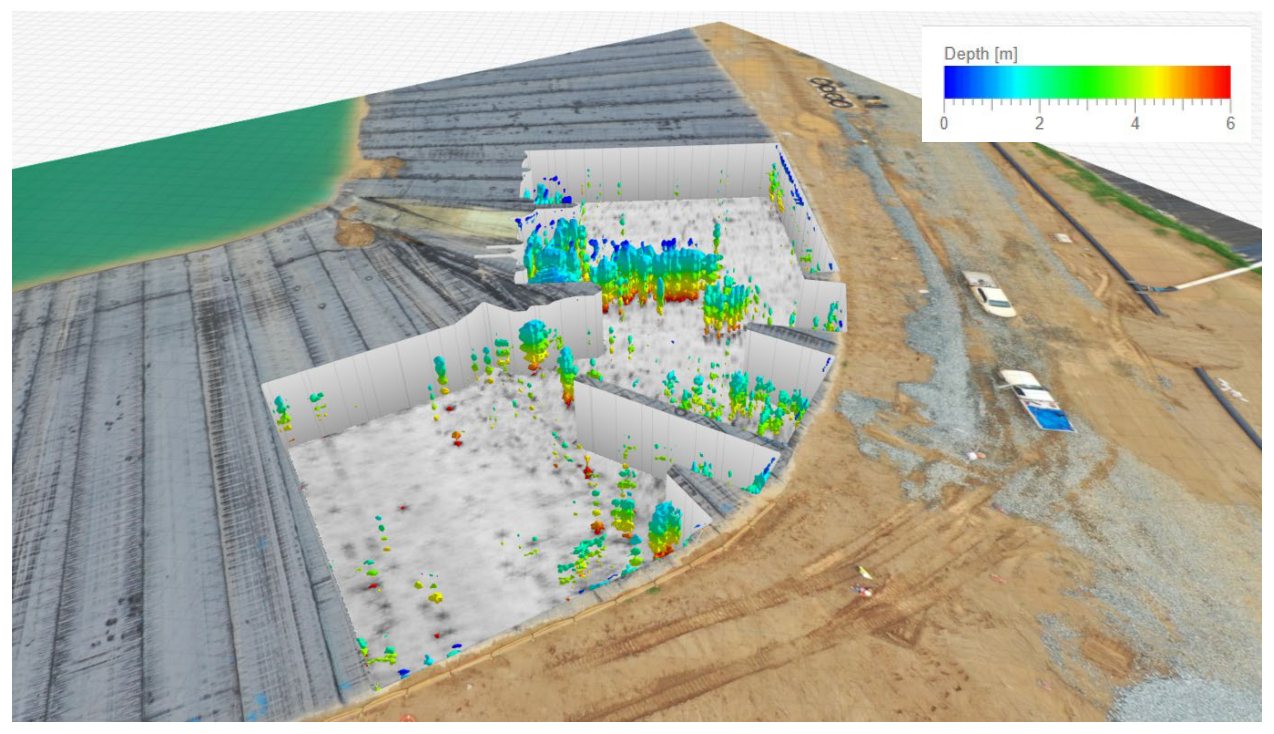 Figure 6
Figure 5: isosurface void mapping across the surveyed extent. An isosurface is a 3D volumetric rendering built by stacking a series of time slices and generating a surface around a threshold value. Figure 6: the isosurface model viewed from the opposite aspect, with depth expressed by colour.
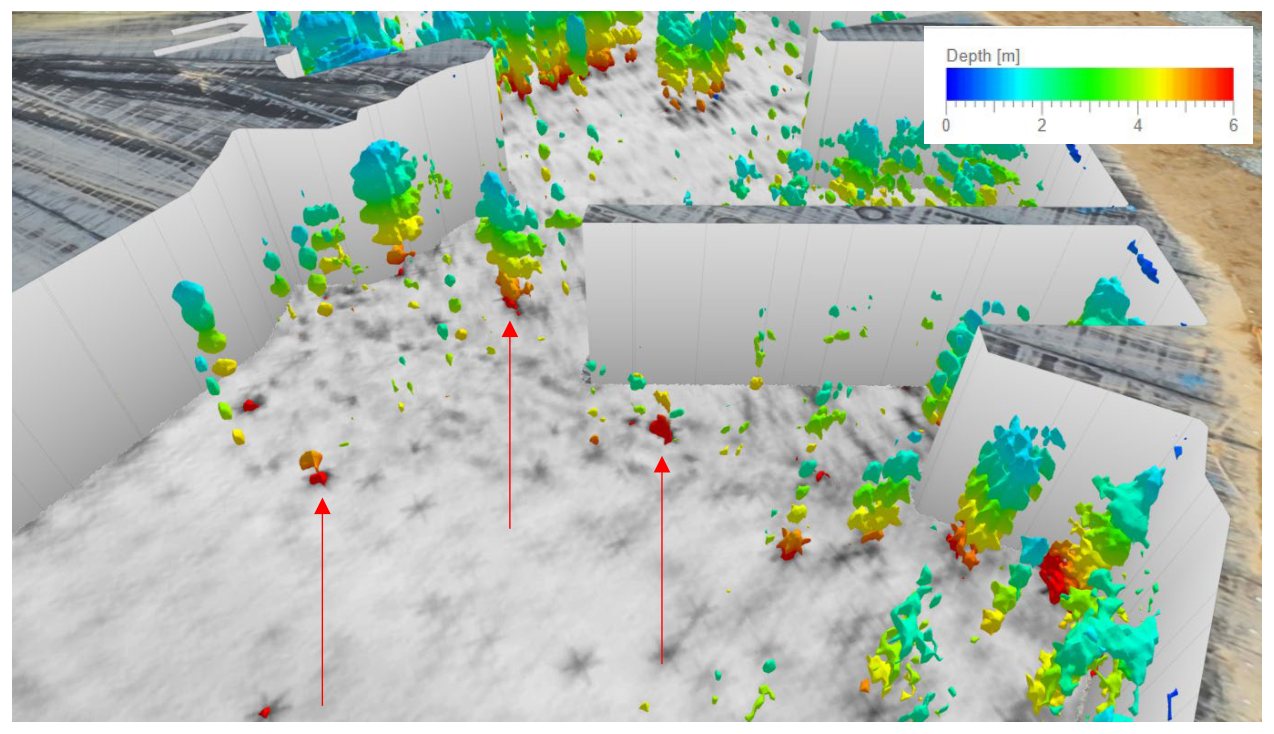 Figure 7
Figure 7: anomalies present in the lower layers that are not evident in the upper layers, arrowed. Surface condition alone would not have identified these.
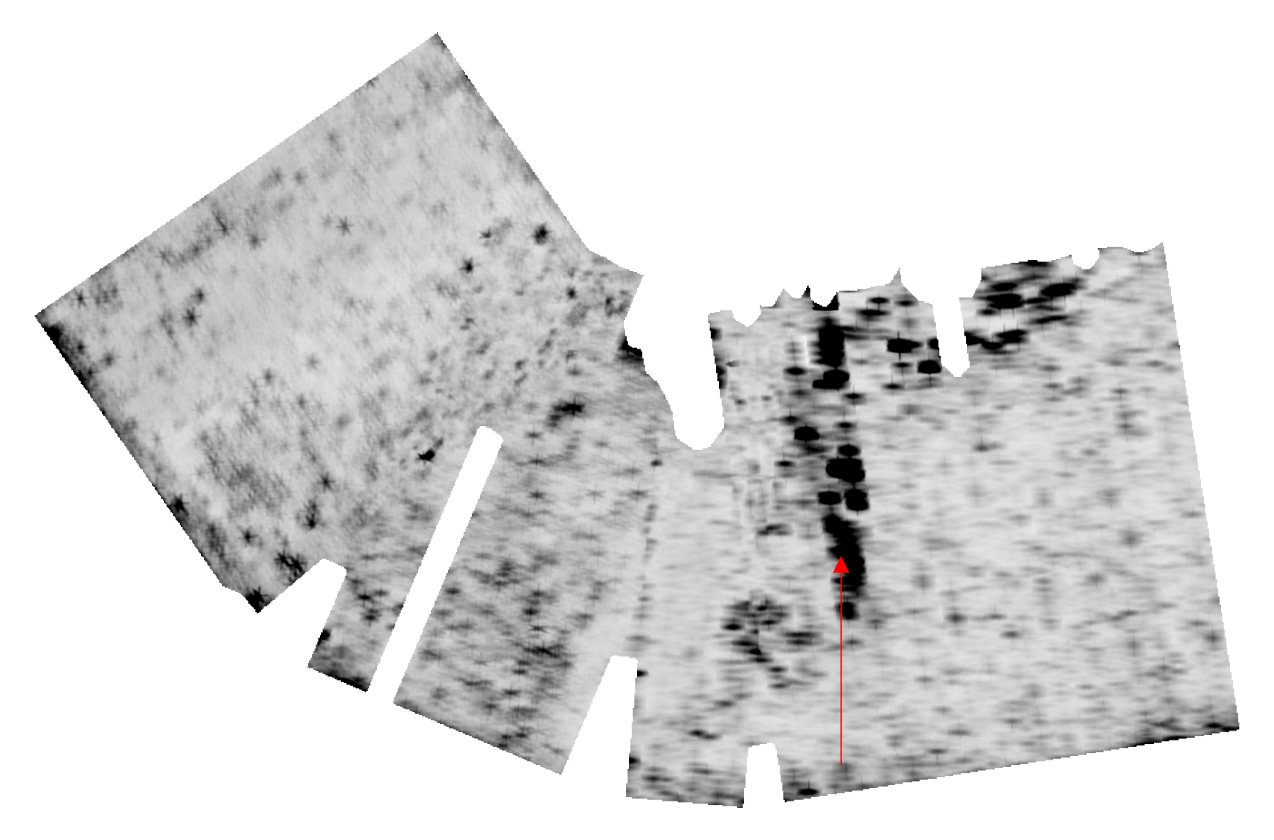 Figure 8
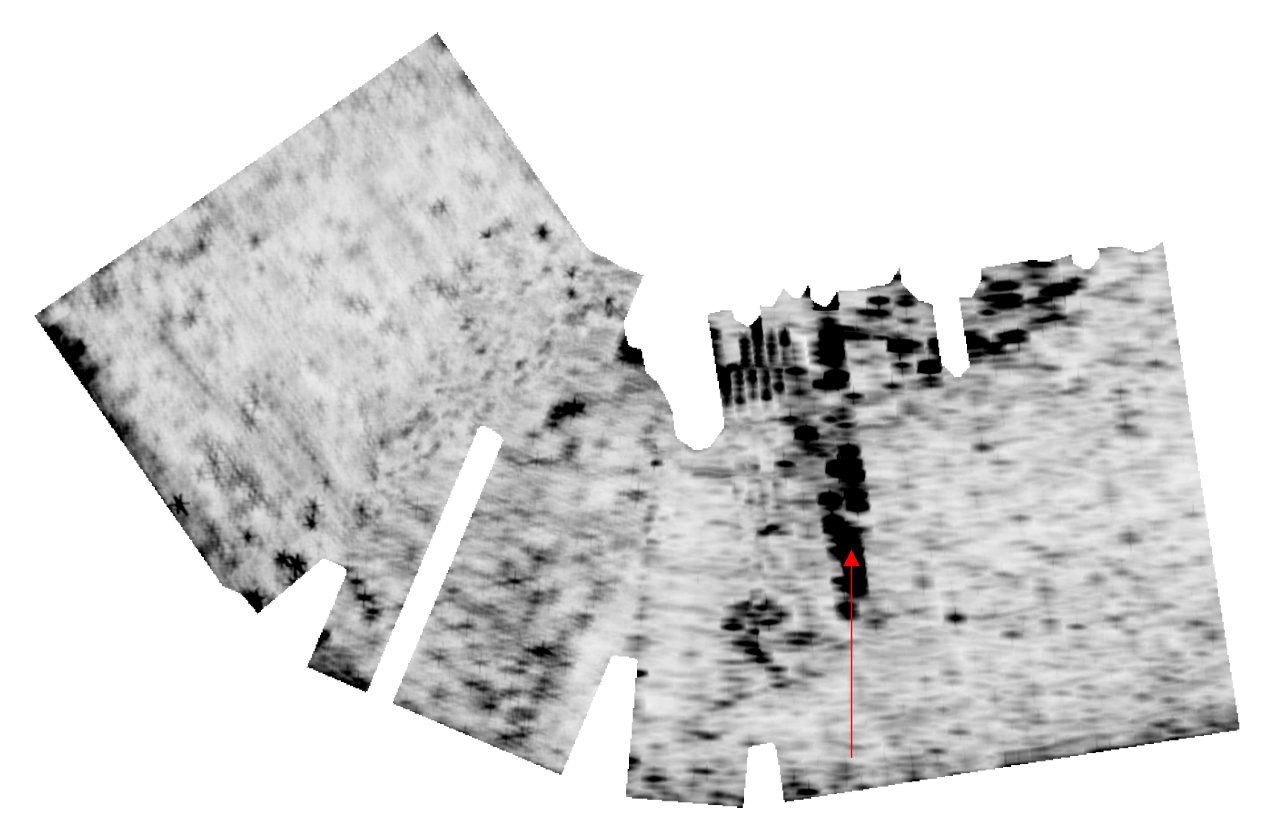 Figure 9
Figure 8: depth slice at 1.0m, with the arrow indicating a potential void. Figure 9: comparative depth slice at 6.8m, indicating that the same anomaly continues through the depth of the scan.
Caveats In Interpretation
The results are subject to a positional tolerance of approximately 1 to 1.5m, owing to the absence of RTK GPS and the reliance on standard GPS accuracy corrected against supplied survey control. All images and interpretations are indicative only. Further investigation, including direct testing, intrusive verification, or additional geophysical survey, may be required to confirm the presence, depth, and extent of any identified void or anomaly.
Potholing or direct excavation is strongly recommended prior to any construction, drilling, or earthworks, to verify subsurface conditions.
What We Took From The Job
Timing Matters More Than Equipment
Moisture infiltration reduced penetration depth measurably. Allowing 12 to 24 hours of drainage after heavy rainfall before scanning would have improved data quality more than any change of hardware. Where a survey window is weather-exposed, that drying period should be built into the programme rather than treated as lost time.
A Tighter Scope Produced A Better Dataset
Concentrating on the two areas of visible degradation, at 750mm line spacing, produced more usable information than a thinner pass across the full original extent would have. Revising scope on site, with the asset owner present, was the right decision.
Positioning Is The Constraint To Solve First
The inability to connect to the site base station cost more in accuracy than any other single factor. On comparable work, base station compatibility should be confirmed before mobilisation, not on the morning of the survey.
Recommendations For Comparable Works
- Time surveys to avoid scanning immediately after heavy rainfall, allowing 12 to 24 hours for drainage.
- Expand coverage to adjacent sections where long-term embankment stability is in question, so that a baseline exists for future comparison.
- Integrate LiDAR to improve terrain modelling and to cross-validate subsurface findings against surface deformation.
- Consider multi-frequency acquisition, deploying 160MHz and 100MHz antennas together, to improve penetration in wet conditions while retaining resolution in the shallow section.
Where This Approach Applies
The method developed here is not specific to tailings storage. The same combination of winch-deployed radar, manual chainage corrected against supplied survey control, and volumetric processing is applicable wherever a steep, lined, or unstable earth structure needs to be imaged without placing personnel on it. Typical applications include:
- Tailings dam and water storage embankments, including lined and unlined faces.
- Levee and flood embankment condition assessment.
- Landfill capping and containment cell integrity.
- Batter and cutting assessment where seepage or internal erosion is suspected.
- Baseline surveys for repeat monitoring, where a defensible dataset is needed against which later surveys can be compared.
Where movement, settlement, or subgrade change is suspected, the geophysical result should be read alongside advice from a structural engineer and a geotechnical engineer. Ground penetrating radar identifies where to look. It does not, on its own, determine cause or certify stability.
Discuss A Similar Survey
If you have a steep, lined, or otherwise inaccessible earth structure that needs to be imaged, we can undertake the scoping, the field acquisition, and the processing as a single engagement.
Disclaimer: This case study presents indicative findings based on ground penetrating radar data and should not be relied upon as the sole basis for engineering, design, or excavation decisions. Positional tolerances of approximately 1 to 1.5m apply, owing to the absence of RTK GPS, and positional accuracy may be affected by manual adjustments made during data processing.
The identification of anomalies, voids, or subsurface features depends on soil conditions, material properties, and the inherent limitations of ground penetrating radar. Further intrusive testing, including potholing or coring, is strongly recommended to verify subsurface conditions. South-East Scanning assumes no liability for damages, misinterpretations, or omissions arising from reliance on this data.
Client and site identifying details have been withheld. This case study is published with the methodology, challenges, and outcomes generalised for the purpose of describing capability.