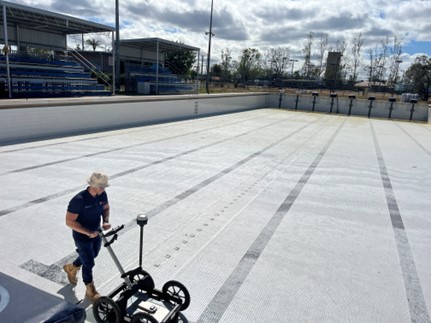
Detecting voids beneath a reinforced concrete slab with 3D GPR
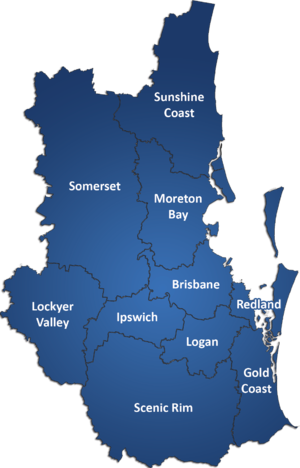
Industrial facility, Berrinba, Logan, South-East QueenslandMcNab needed to know whether voiding had developed beneath an external reinforced concrete slab at an industrial facility in Berrinba, and needed the answer in a form that engineers, insurers, and legal advisers could rely on. We completed a 3D ground penetrating radar (GPR) survey of four targeted areas with the IDS C-Thrue, processed the data into reinforcement and void maps for each area, and returned during rectification works to check two further areas of the slab.
Evidence that would stand up well beyond the site
Voiding beneath a slab rarely shows at the surface until it has already caused cracking or movement. McNab suspected that the external slab had lost support in places, and the question had moved beyond the site: the findings needed to stand up to review by structural engineers, insurers, and legal representatives.
That set the brief. A few scan lines and crayon marks would not be enough.
The client needed a repeatable, documented dataset for each area of concern, a clear distinction between what the radar showed and what it could not show, and a report that kept observation separate from engineering conclusion.
The site added its own considerations:
The slab is reinforced with a closely spaced bar grid, which can mask the material beneath it on a conventional 2D scan.
A stormwater drain runs beneath part of the surveyed area, and its reflection had to be separated from any genuine voiding.
The slab remained in use, so the investigation had to be non-destructive, with no coring or breakout.
A true 3D dataset, captured with no coring or breakout
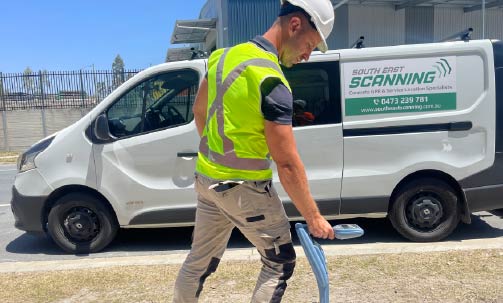
We established four grids, each 2.8m x 2.8m, at the locations nominated for investigation. Each grid was set out with a straight edge at 100mm spacings, giving 28 scan lines in each direction. The orthogonal layout balances resolution against time on site, and produces a true 3D dataset rather than a set of isolated profiles.
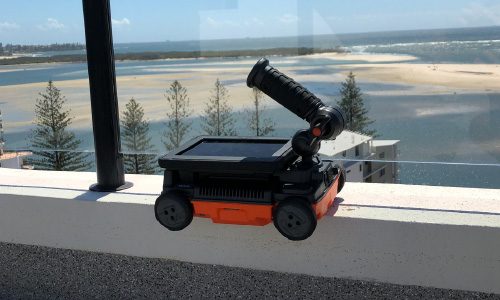
Data were collected with the IDS C-Thrue, a dual-polarised GPR system designed for reinforced concrete. Recording in two polarisations helps resolve reinforcement running in both directions, and makes the material beneath it easier to read.
The raw data were processed in Geolitix, with a propagation velocity of 0.1 m/ns applied to convert travel time to depth. For each location, we produced:
Horizontal slices through the slab at incremental depths, in which uniform concrete returns low amplitude (blue) and changes in material properties return higher amplitude (green to red).
At bar depth, used as the baseline for the location.
Below the reinforcement, isolating the response from the underside of the slab.
Every zone of elevated amplitude in a void map was then checked against the vertical profiles (B-scans) beneath it, so that each finding rests on two views of the same data (refer to Figure 1).
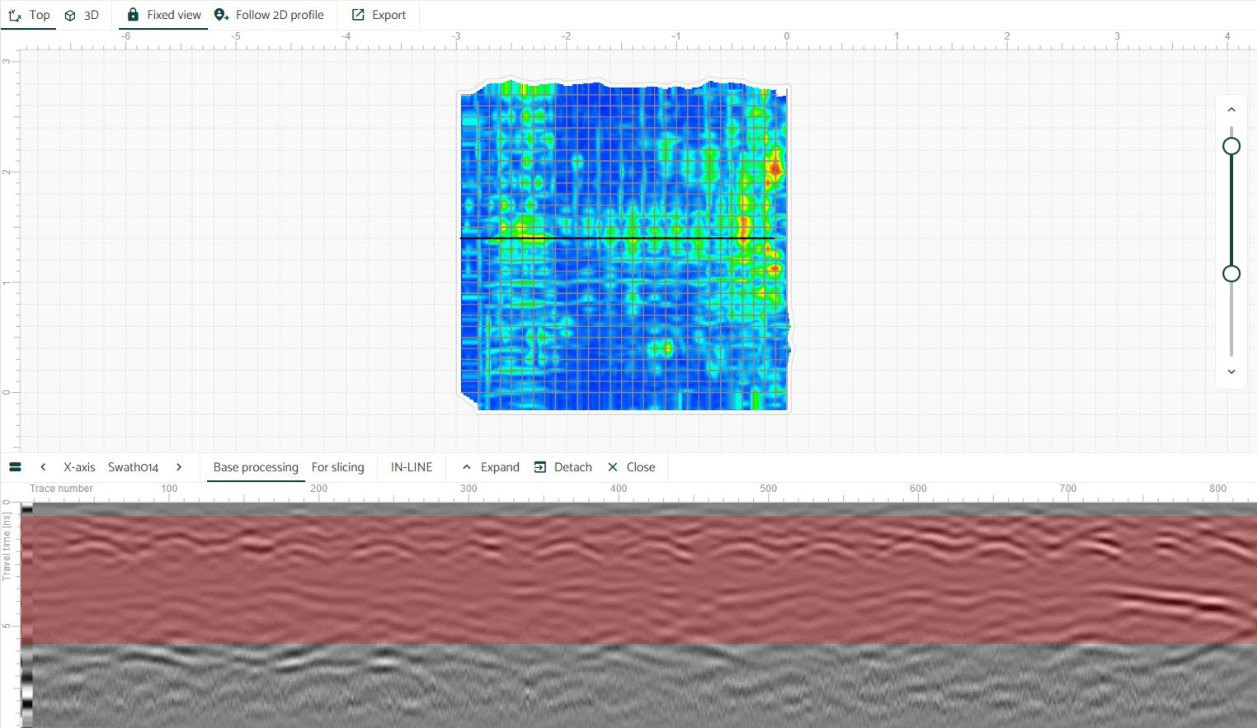
Figure 1. Geolitix depth slice (top) with the corresponding B-scan (bottom). The strong lateral reflection at right sits beneath the reinforcement, at approximately 200mm to 250mm (+/- 20%).
Four grids, four different answers
At all four locations, the reinforcement grid resolved clearly, with consistent spacing and alignment. Beneath it, the picture varied considerably from one location to the next.
Only small, isolated zones of elevated amplitude beneath the reinforcement, at approximately 200mm to 220mm (+/- 20%). The slab response was otherwise uniform.
Multiple high-amplitude zones at approximately 200mm to 250mm (+/- 20%), consistent with the underside of the slab. The most extensive of the four locations.
As at Location 1, only small, isolated zones at approximately 200mm to 220mm (+/- 20%), limited in extent. The slab response was otherwise uniform.
The strongest response of the whole survey, along one edge of the grid. It coincided with a stormwater drain beneath the slab. Away from the drain, the slab response was uniform.
28 scan lines in each direction at every location.
Consistent with the underside of the slab.
Small, isolated zones, limited in extent.
Schematic only. Zone shapes and positions are simplified from the void maps in the report and are not to scale.
One priority location, and a drain that looked like a void
Location 2: the main area of concern
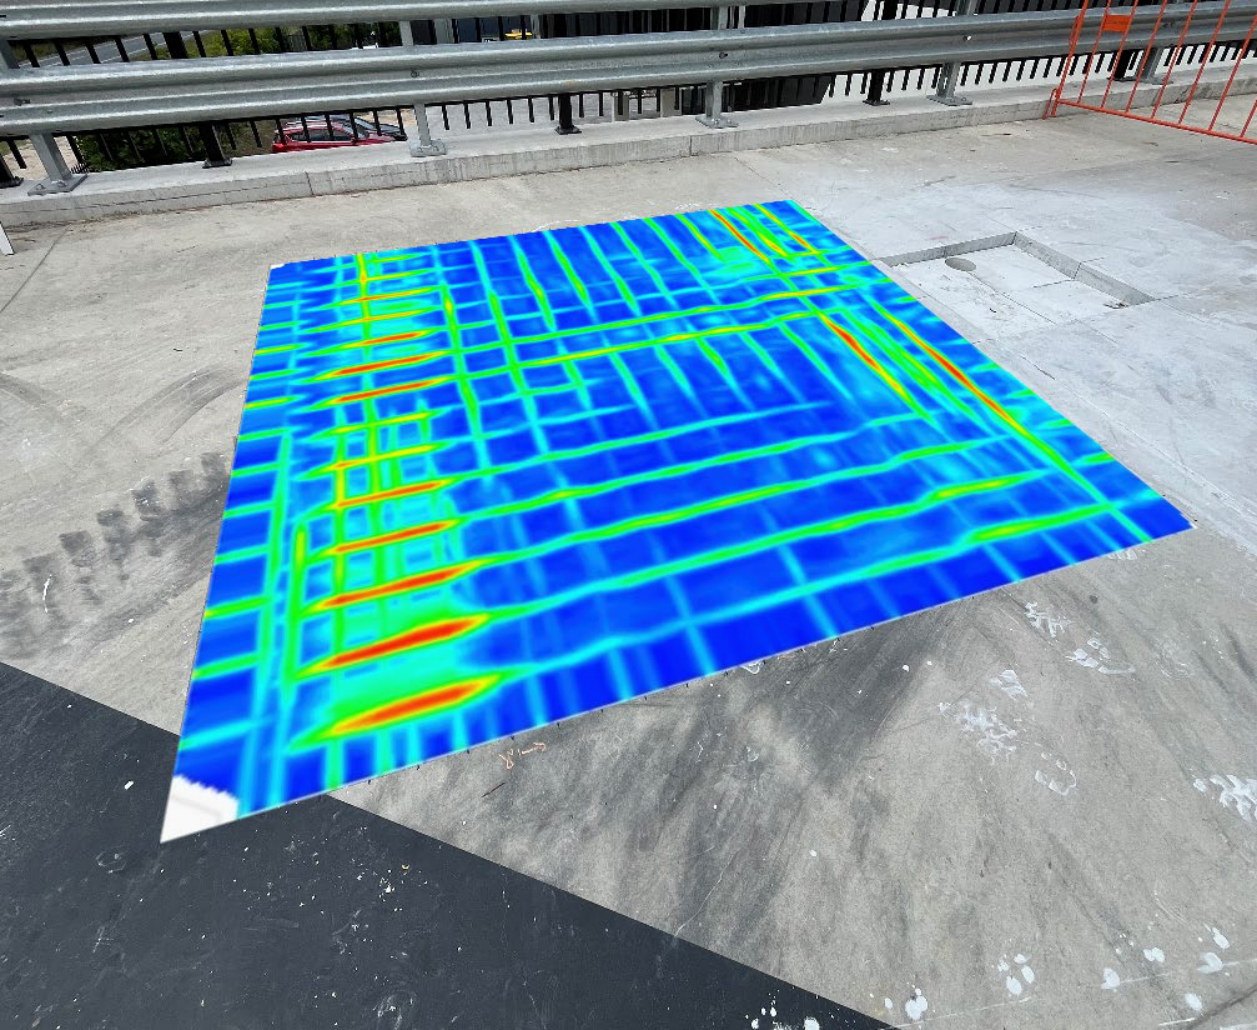
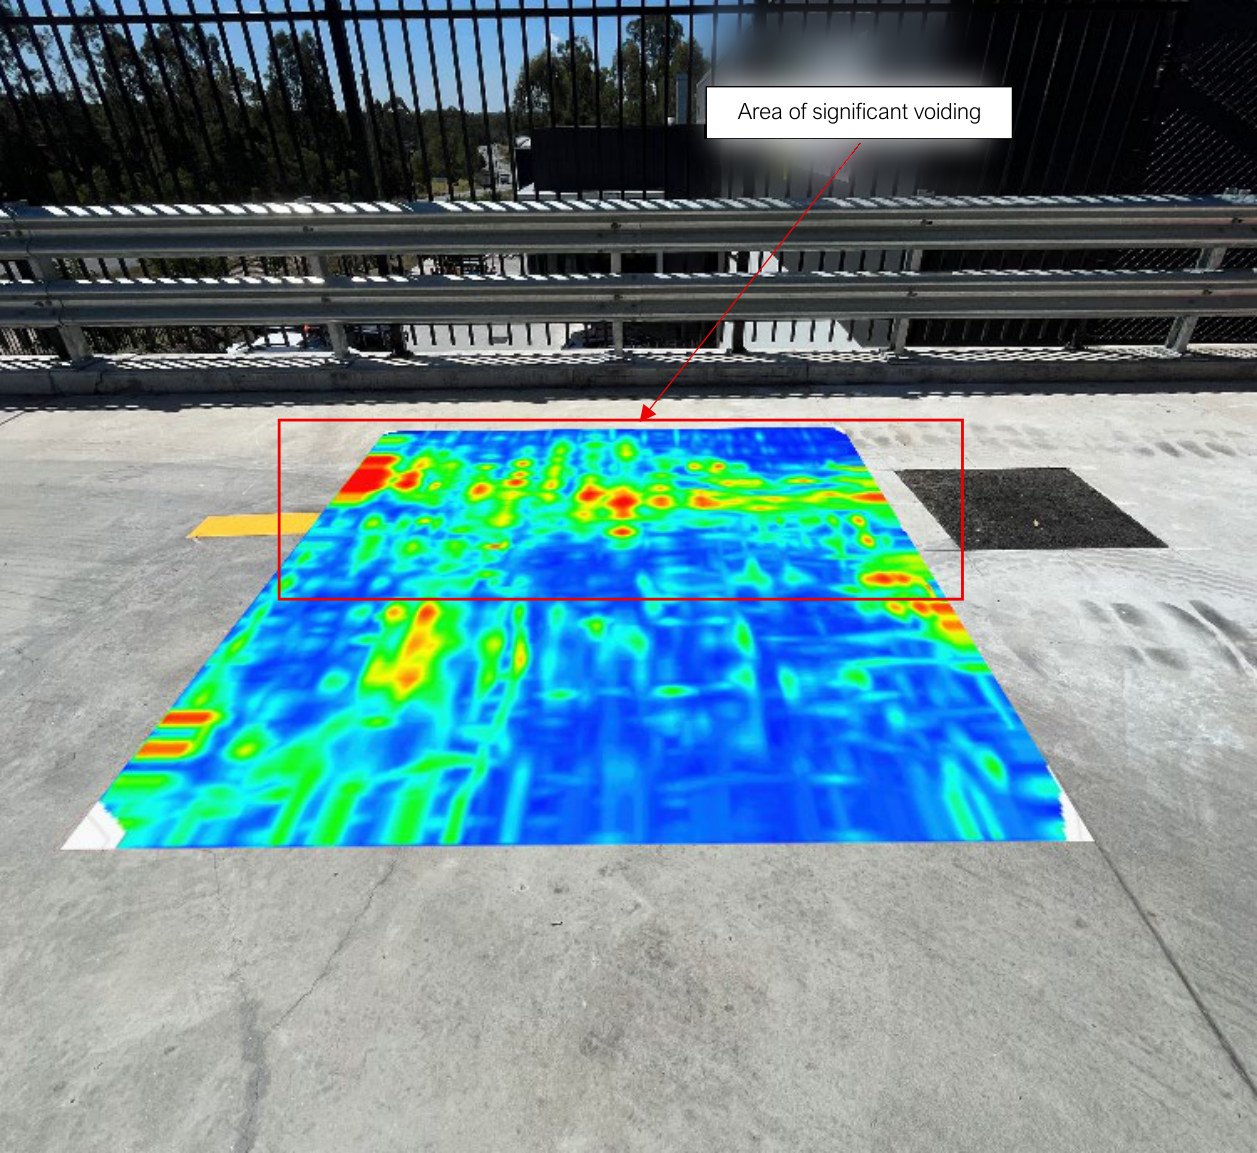
The reinforcement map at Location 2 showed localised disturbances beneath the bar grid (refer to Figure 2). In the void map, these resolved into multiple high-amplitude zones at approximately 200mm to 250mm (+/- 20%), consistent with the underside of the slab (refer to Figure 3).
The response is indicative, by observation, of thin, shallow voiding or loss of contact directly beneath the slab, rather than a large open cavity.
It was the most extensive of the four locations, and the report identified it as the priority for engineering assessment.
Locations 1 and 3: minor, isolated responses
At Locations 1 and 3, the void maps showed only small, isolated zones of elevated amplitude beneath the reinforcement, at approximately 200mm to 220mm (+/- 20%). These were limited in extent, and the slab response at both locations was otherwise uniform.
Location 4: a strong reflection that was not a void
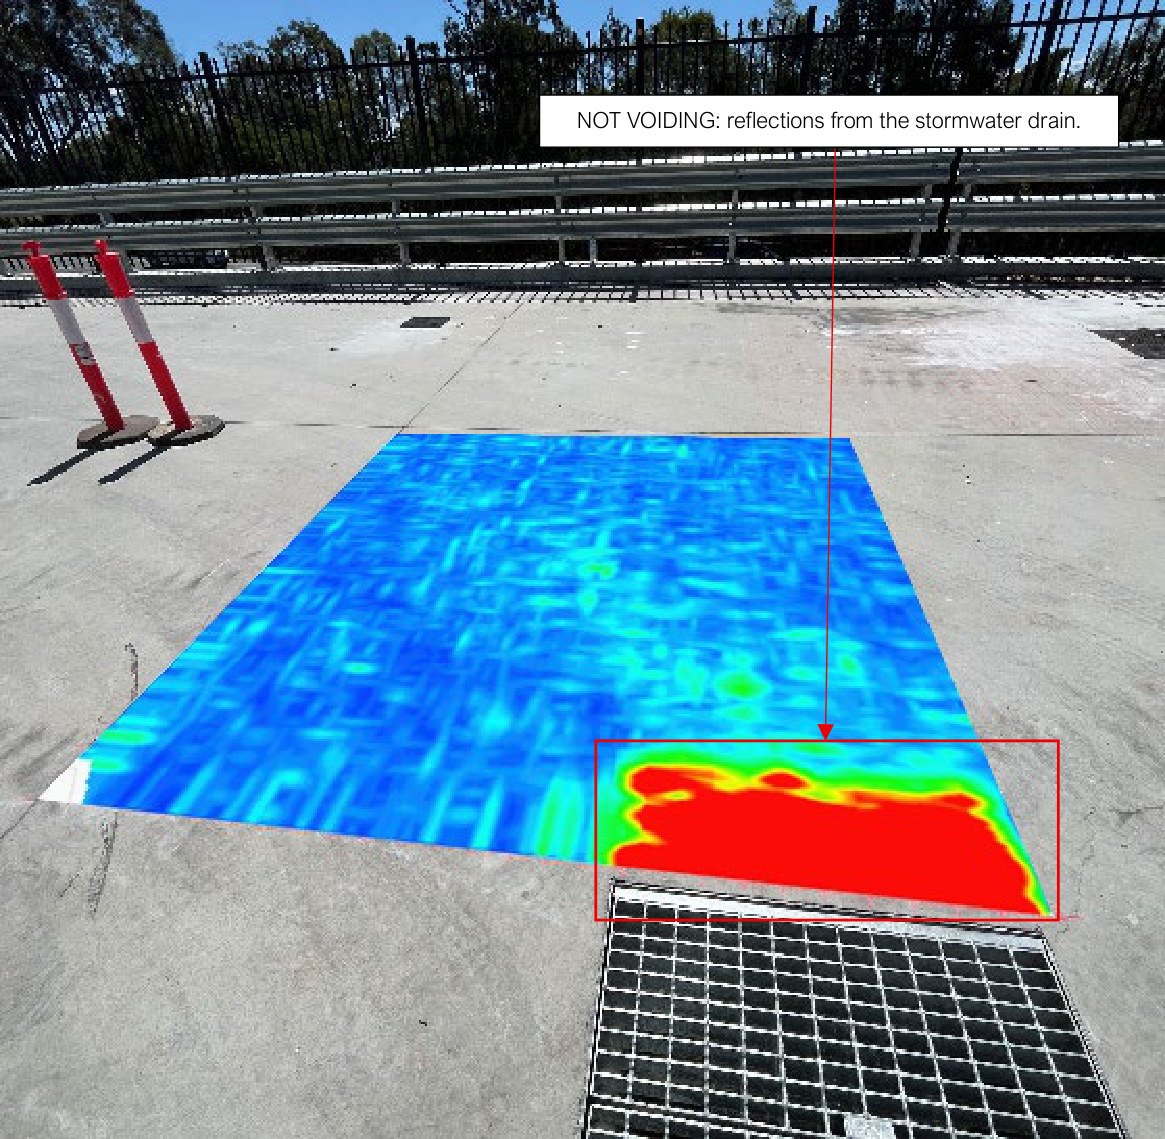
The void map at Location 4 contained the strongest response of the whole survey: a solid red zone along one edge of the grid. It coincided with a stormwater drain beneath the slab, and the report identifies it as the drain, not as voiding (refer to Figure 4). Away from the drain, the slab response was uniform.
This is where 3D data earn their keep.
On a single 2D profile, a strong reflection beside a drainage pit is easy to misread. In plan, its shape and position relative to the pit make the source clear.
Indicative findings, kept separate from engineering conclusions
GPR records contrasts in the electromagnetic properties of materials. On its own, it cannot reliably separate an air gap from trapped moisture or low-density material beneath a slab, and resolution reduces with depth. Possible mechanisms for the responses recorded here include:
The data alone do not distinguish between them.
For a report headed to insurers and legal advisers, that discipline matters as much as the data.
Our report says so plainly. It presents each finding as indicative, leaves cause and engineering conclusions with the structural engineer, and recommends intrusive confirmation before remediation is designed.
A formal report, maps for every location and clear next steps
- A formal investigation report, with an executive summary, methodology and limitations, results by location, and an interpretation section.
- Reinforcement and void maps for each of the four locations, overlaid on site photographs so each finding can be located on the slab.
- Representative B-scans validating the depth slices.
- Access to the interactive Geolitix datasets, retained as a baseline record of the slab condition.
Recommendations
The report closed with clear next steps:
A structural engineering review, with consideration given to intrusive testing, such as core sampling, to confirm the extent and severity of the responses.
Remediation options, such as grouting or slab stabilisation, to be considered by the engineer for the affected areas, particularly Location 2.
Checking new areas during rectification
As rectification works progressed, the site engineer identified two further areas of the slab for checking and asked us to return. On 10 November 2025, we scanned both areas with the IDS C-Thrue in both polarisations, and processed the data with the same method, so the results could be compared directly with the original survey.
A few small, isolated, high-amplitude zones near one corner of the grid, appearing at corresponding positions in both polarisations. They lacked the bounded, laterally continuous signature of the voiding recorded earlier, and are indicative, by observation, of minor discontinuities such as moisture variation or a cold joint, rather than delamination.
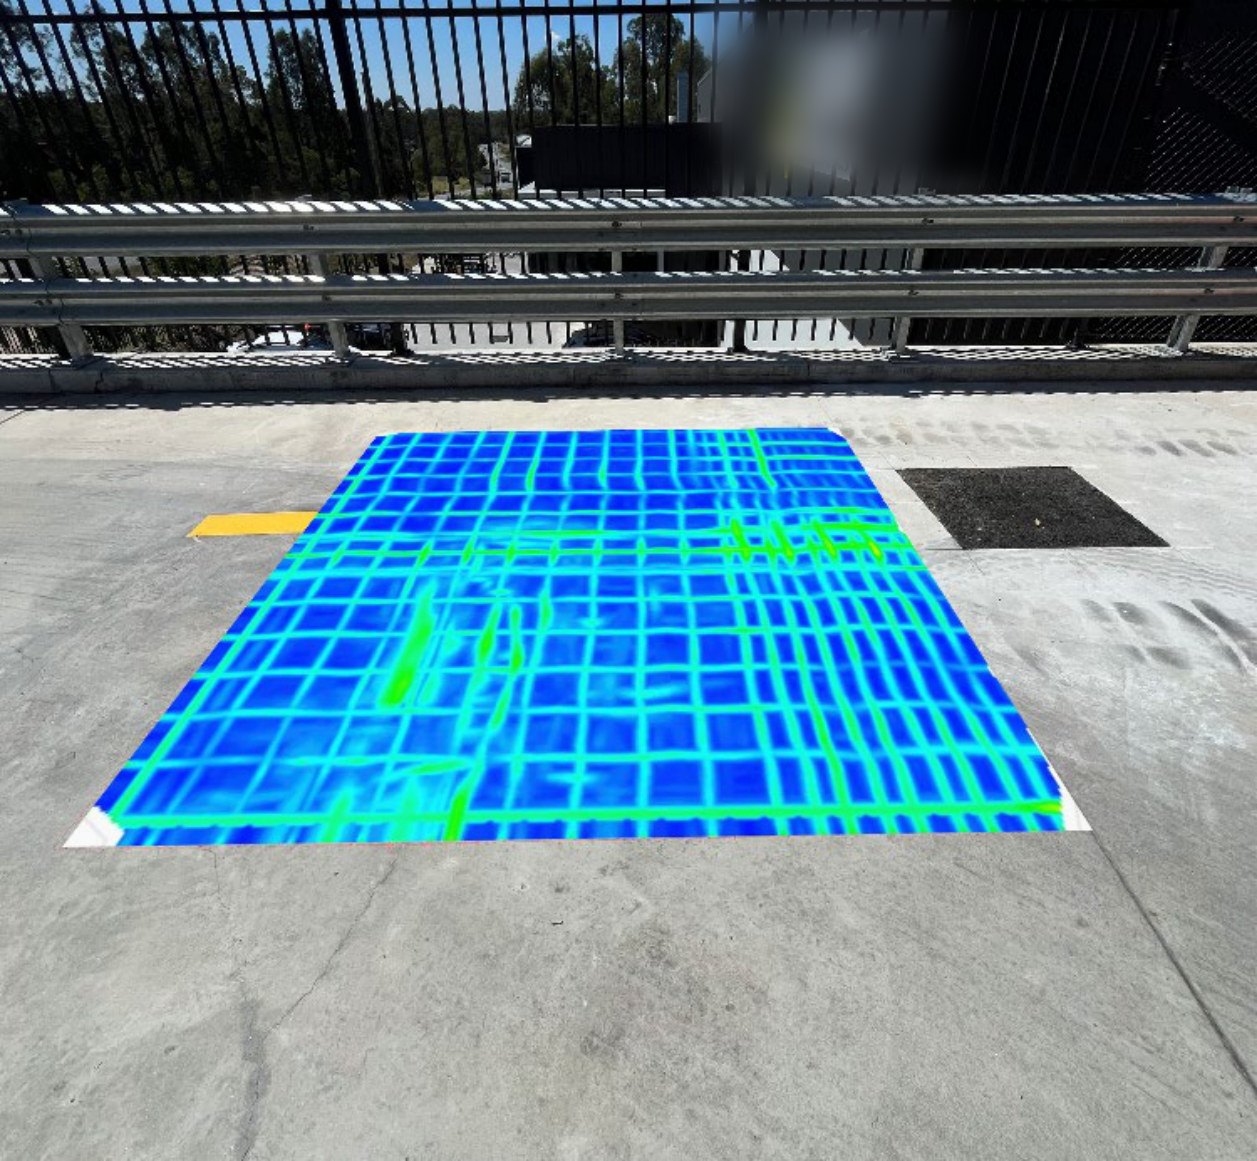
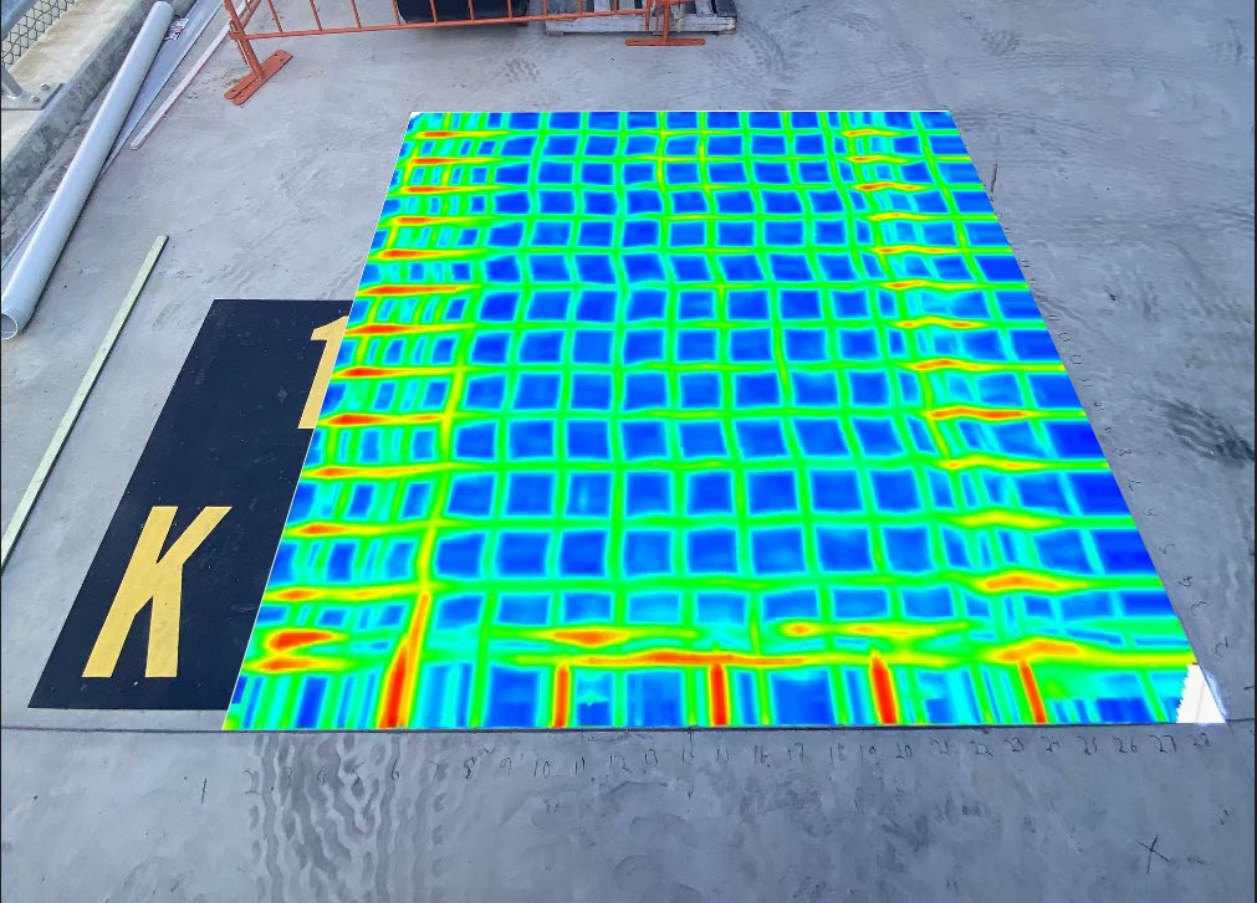
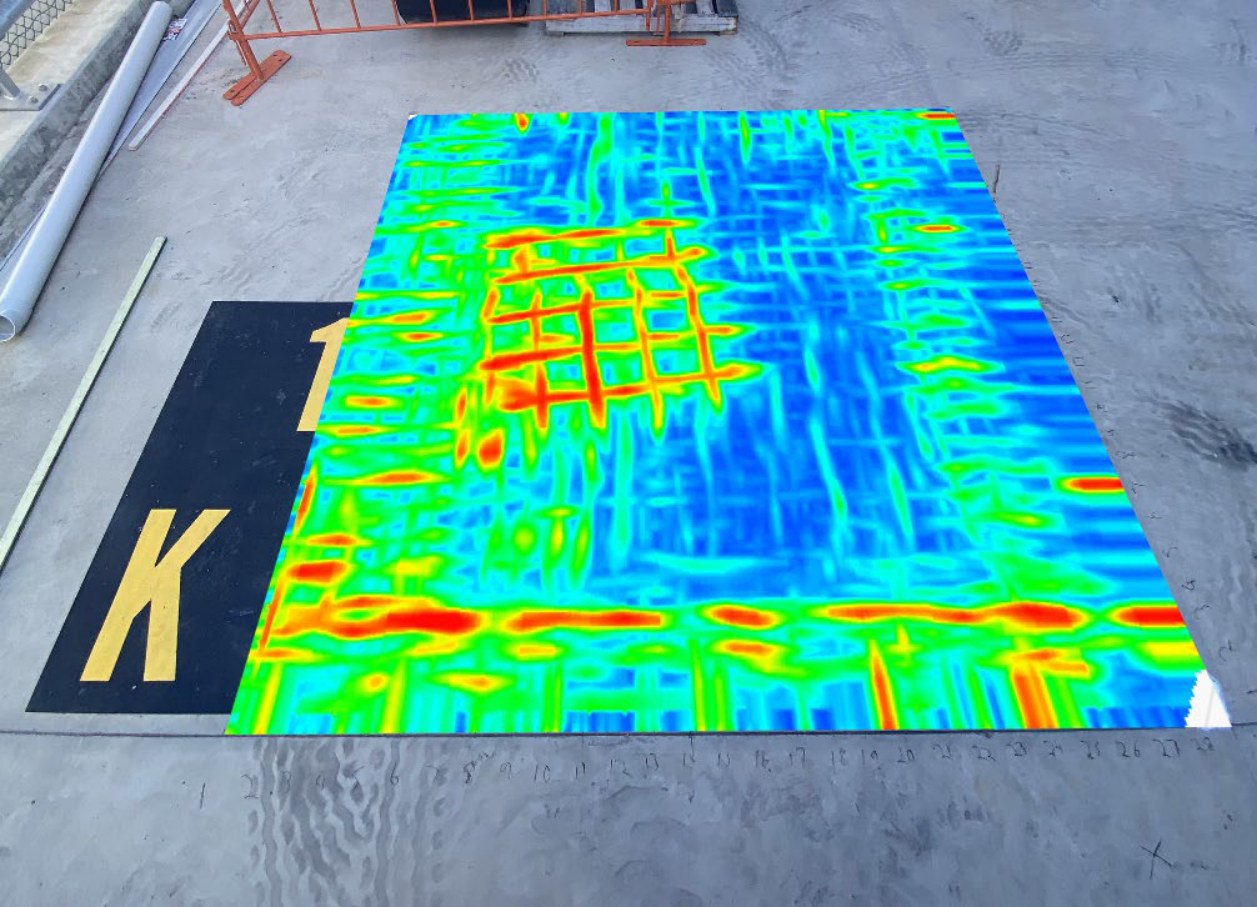
An unusually dense, bright grid. Comparing the two polarisations showed an additional mesh panel overlapping within the upper reinforcement layer, rather than a second layer at depth or a defect. The concrete around it presented as uniform, with no indicators of voiding or delamination (refer to Figures 5 and 6).
Being able to rule an area out is as useful to a rectification program as finding a defect.
The return visit gave the site engineer evidence to direct effort where it was needed.
Engineering attention directed where it was needed
McNab received a documented, repeatable picture of the slab: where the responses were concentrated, where they were minor, and where a strong reflection had an ordinary explanation. Engineering attention could be directed at Location 2 rather than spread across the whole slab, and the same method was used again to check new areas as rectification proceeded. The datasets remain on record as a baseline for future comparison.
Why use 3D GPR for slab void investigations?
Voiding beneath a slab is invisible from above until it starts to cause damage, and a core tells you about one point at a time. A 3D GPR survey shows you the condition across an area before anything is cut:
The same approach applies to warehouse floors, hardstands, driveways and ramps, podium slabs, and other reinforced concrete where loss of support is suspected.
Find out more about our concrete scanning in Brisbane, GPR scanning in Brisbane, advanced GPR data processing, and structural investigation and analysis. For related work, read our case studies on the warehouse slab assessment at Arundel and the GPR survey for under-slab voids at Logan Village.
3D GPR for concrete slab voids
Can GPR detect voids under a concrete slab?
GPR detects changes in the material beneath a slab, such as voiding, saturation, or low-density material, as zones of elevated reflection amplitude. It cannot identify the composition of a reflector on its own, so zones of concern should be confirmed by intrusive investigation, such as coring.
What is a C-scan or depth slice?
A depth slice is a plan view through the GPR data at a chosen depth, built from a grid of closely spaced scan lines. It shows the extent and shape of reinforcement, services, and anomalies across an area, rather than along a single line.
Why does the reinforcement matter?
Closely spaced reinforcement returns strong reflections that can mask the material beneath it. Producing a separate reinforcement map and void map for each area, and checking each zone against the B-scans, makes the response beneath the bars much easier to interpret.
Can GPR tell the difference between a void and a buried service?
Often, yes, when the data are viewed in 3D. A pipe or drain tends to show as a continuous, well-defined feature that lines up with pits and known infrastructure, while voiding presents as irregular zones. At this site, the strongest reflection in the survey was identified as a stormwater drain, not voiding.
Does a GPR survey replace a structural engineer?
No. GPR provides evidence about subsurface conditions; it does not provide engineering certification. Our reports recommend assessment by a structural engineer, and by a geotechnical engineer where subgrade concerns are involved, wherever loss of support or movement is suspected.
Talk to us about your project
We can undertake 3D GPR investigations of slabs, hardstands, decks, and other reinforced concrete across Brisbane, Logan, the Gold Coast, and the Sunshine Coast. For a quote or to discuss a site, call 1300 175 543 or email info@southeastscanning.com.au.