The reflection that pointed the wrong way
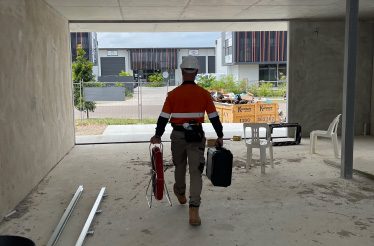
A circular potable water reservoir in South-East Queensland, drained for twenty-four hours. Roughly eighty cracks, no construction records, and an open brief. What ground penetrating radar could establish, and what it could not.
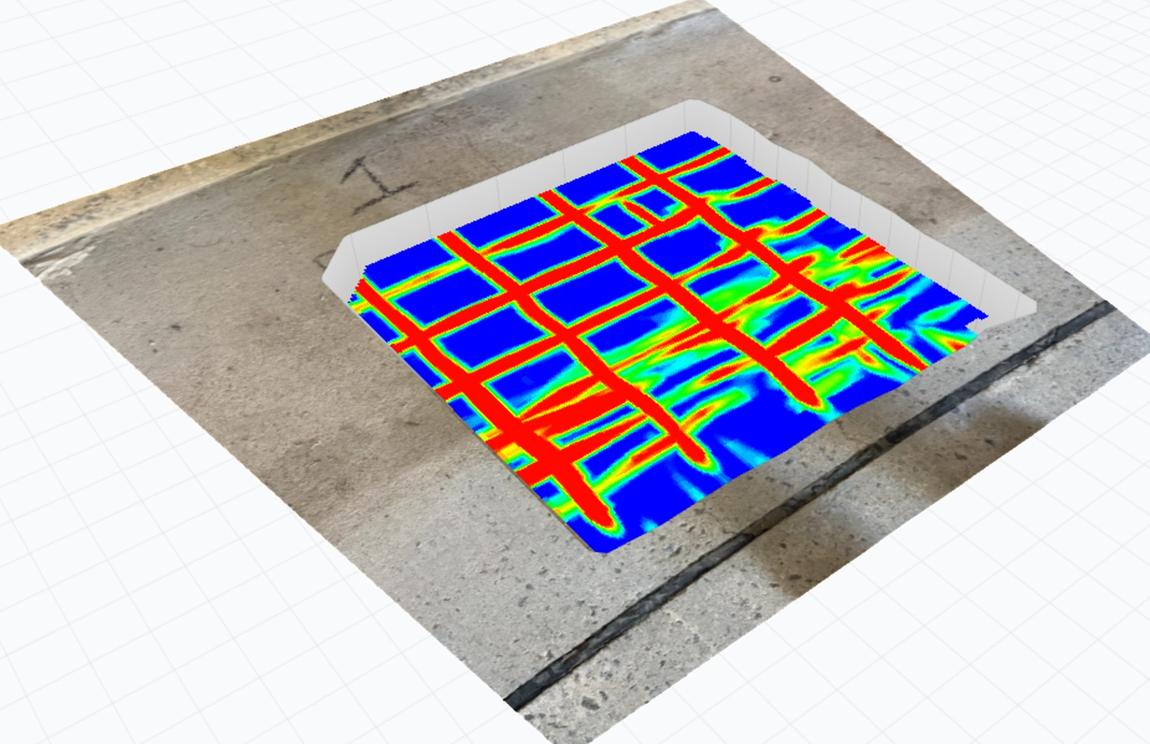
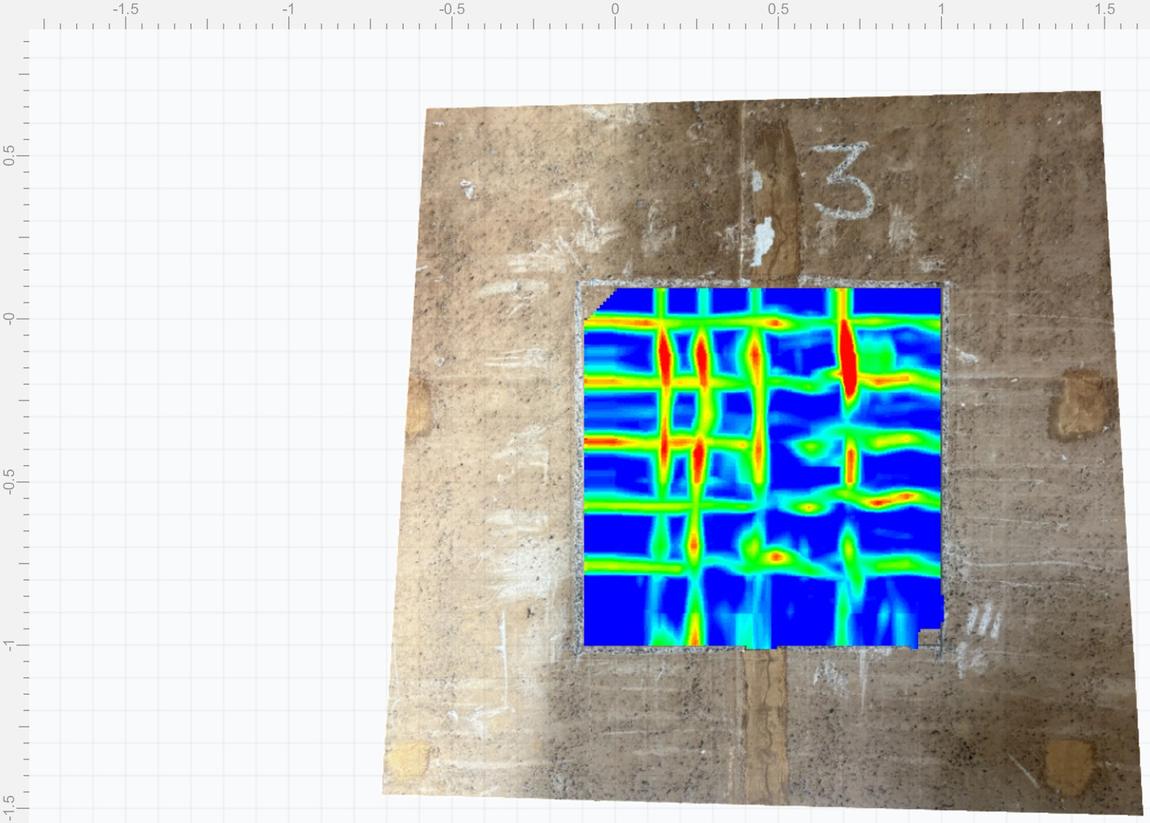
Depth slice at the upper reinforcement layer, registered to site photography in Geolitix.
Scan it, and tell us something
The engineer had a problem and very little to go on. Cracking had been observed across the reservoir floor and wall. Many of the cracks had been repaired before, with rigid cementitious bands laid over the crack line, and cracking had re-opened through a good number of those repairs along their full length.
There were no construction drawings. No record of the structure's age. No maintenance history. And no defined scope beyond a request to investigate the floor.
An open brief on a liquid-retaining structure is the riskiest kind of engagement there is. Our first job was to define the scope ourselves, in writing, so that everyone knew exactly what had been covered and what had not.
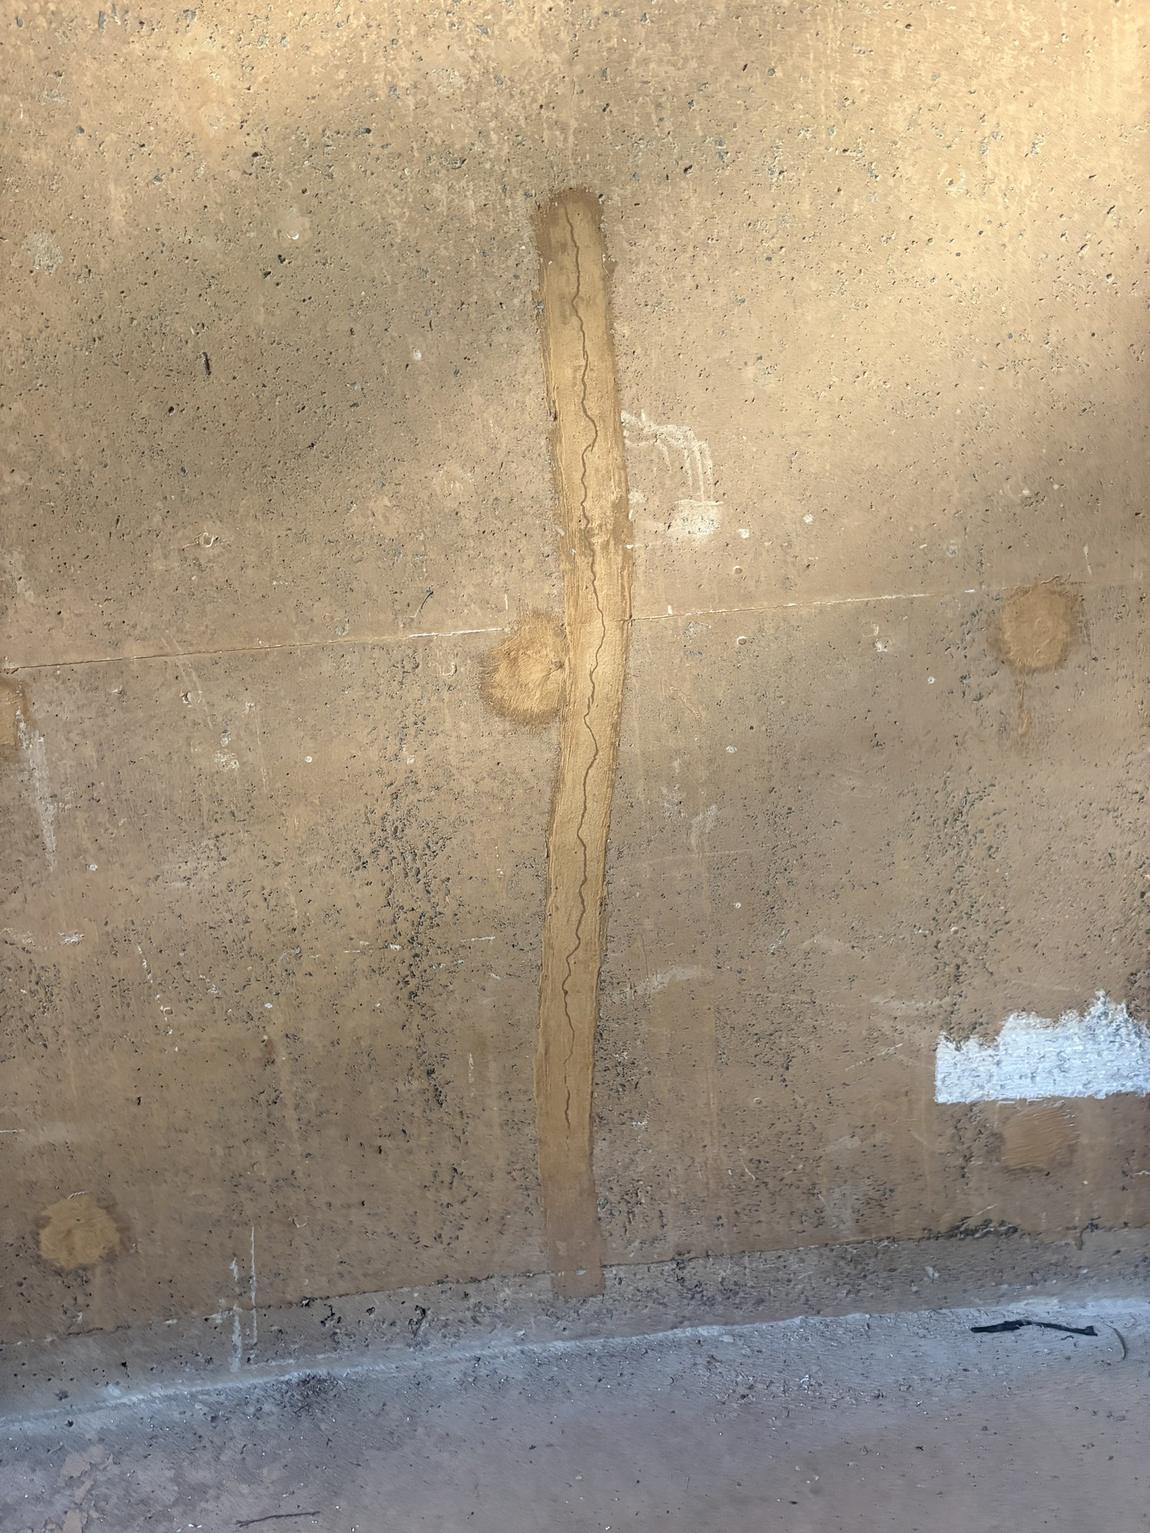
Cracking re-opened through the full length of a previous repair.
Three grids, one of them deliberately boring
We acquired three orthogonal three-dimensional radar grids, two in the floor slab and one in the wall, plus a continuous traverse around the internal wall perimeter. Every grid was positioned deliberately over a crack.
The third grid was the important one, and it was chosen precisely because we expected it to show nothing. It became the control. If a location with no anomalies returned clean, well-resolved data on the same day with the same equipment, then any degradation elsewhere was a property of the concrete rather than a limitation of the survey.
That distinction is the difference between a finding and an excuse, and without a control you cannot make it.
A control location is not wasted time. It is what turns “we couldn’t see clearly” into “there is something there.”
Concrete drained for a day sits at or near saturation, which slows the radar wave and eats the signal. The software default of 0.100 m/ns would have overstated every depth by roughly a fifth. We reprocessed at 0.085 m/ns and cross-checked the result against cover meter readings taken on the same bars, since electromagnetic induction is unaffected by moisture.
Everything in this job is a question of depth
Four horizons mattered in a slab of roughly 300 millimetres. Two were reinforcement. One was the base. One was not supposed to be there at all.
Resolved in both the floor and the wall, on a 200 × 300 mm mesh. Cover was consistent across every area surveyed, including directly at the crack lines, and independently confirmed by cover meter.
Confirmed by two instrumentsA laterally continuous reflector sitting between the two reinforcement layers, directly beneath a crack that had already re-opened through a previous repair. Its polarity ran opposite to that of the steel.
Indicative, requires confirmationSame mesh configuration, with additional bars detected in the lower layer of the floor. The wall and the floor returned the same arrangement, which gave us a coherence check on the interpretation.
ResolvedA reflection was identified at approximately this depth, but attenuation through saturated concrete and masking by two layers of steel meant it could not be confirmed. We reported it as an interpretation requiring verification, not as a measurement.
Not confirmed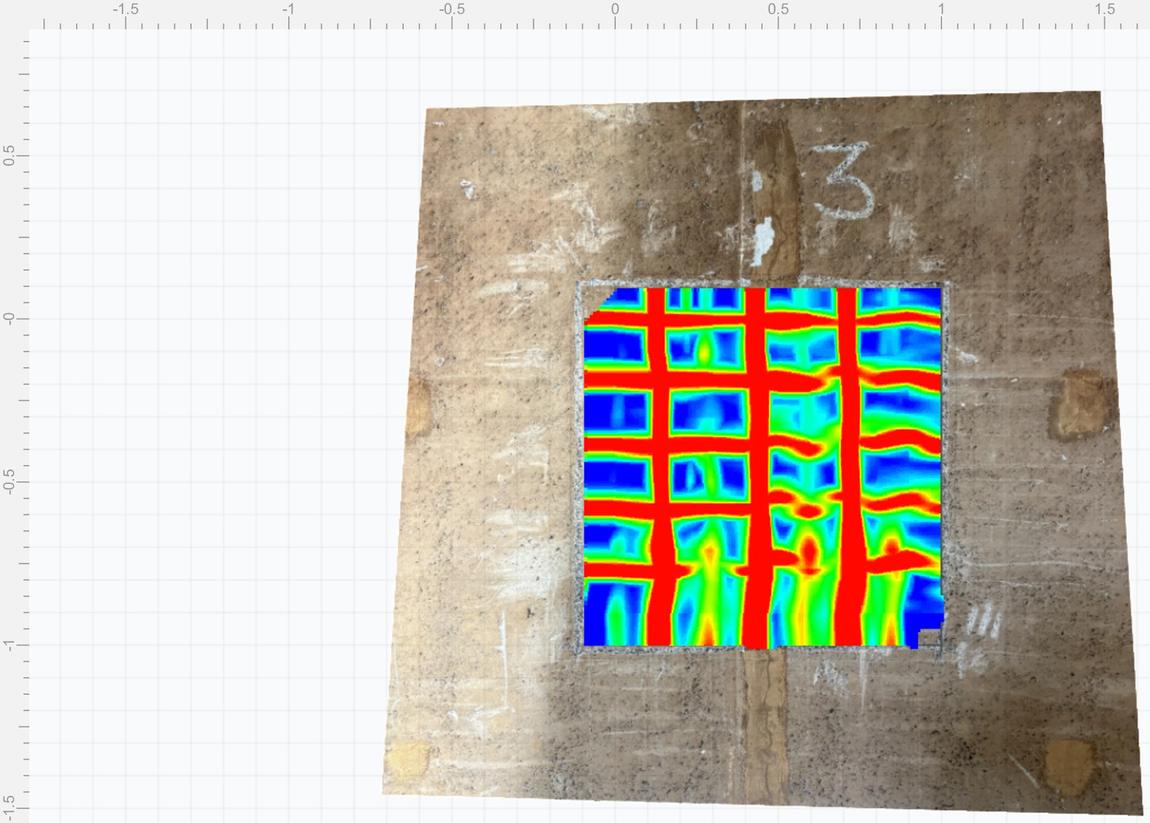
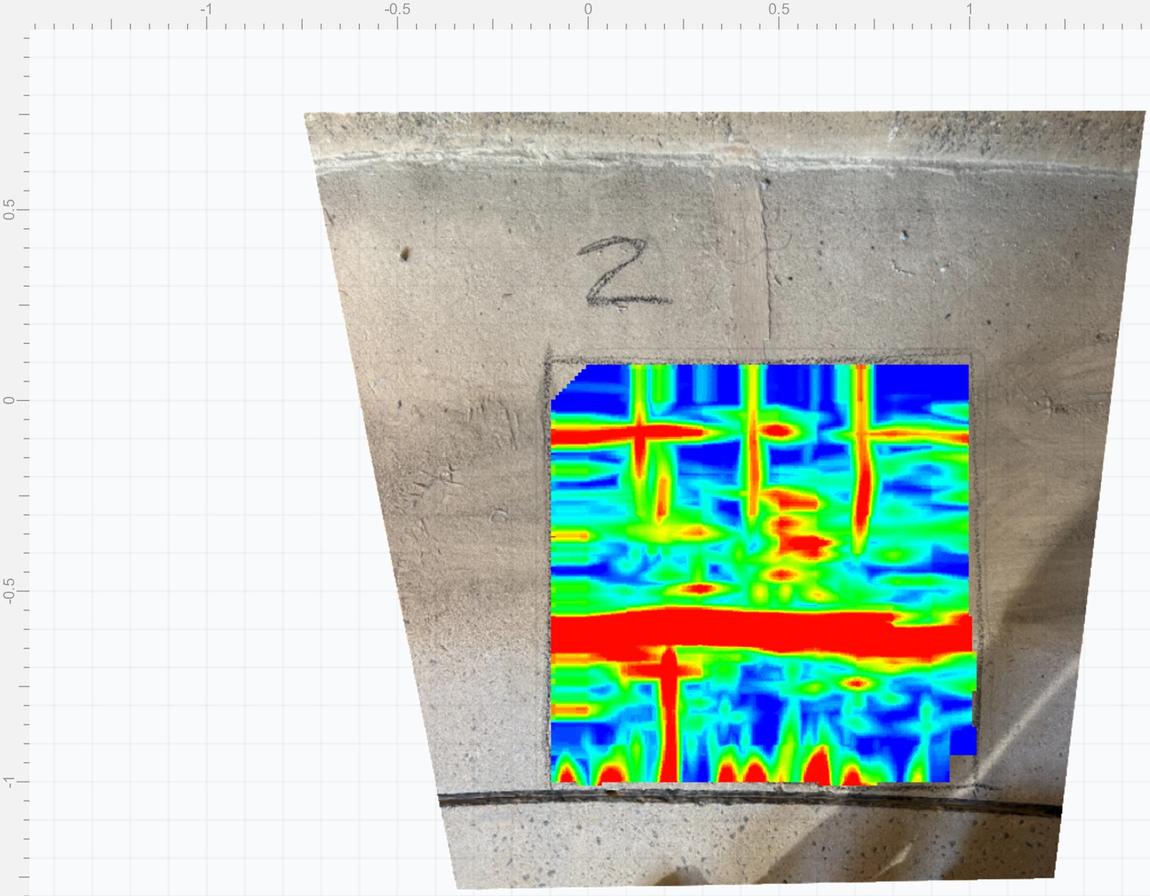
Water and air reflect in opposite directions
A reflector on its own tells you something is there. It does not tell you what. On a water-retaining structure that had been full a day earlier, the obvious reading was trapped moisture, and it would have been easy to write it up that way.
Polarity settles it. A concrete-to-water interface reflects with the same sign as steel. A concrete-to-air interface reflects with the opposite sign. Read on the base-processed section rather than the transformed one, since an envelope transform discards the sign entirely, the anomaly ran opposite to the reinforcement in the same trace.
That points away from moisture and towards a low-dielectric, air-filled discontinuity: a delamination or a debonded plane. And because it sat within the slab rather than beneath it, it indicated an internal defect rather than loss of support underneath, which is a materially different problem for the engineer to solve.
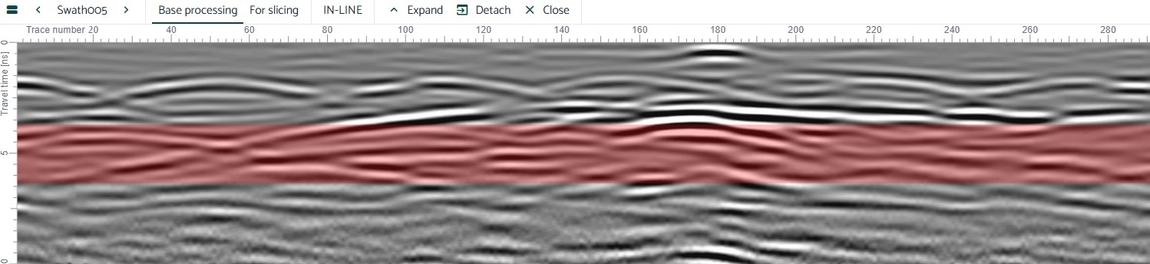
Processed section at the anomaly location.
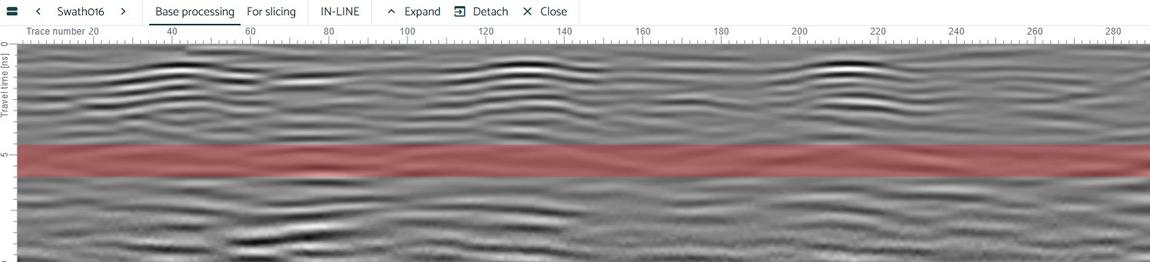
The control location. Two clean horizons, nothing between them.
The cracks were invisible to the instrument, and we said so
At 2 GHz through saturated concrete the wavelength is about 42 millimetres, which puts realistic vertical resolution somewhere between 10 and 20 millimetres. The cracks at this site measured under a millimetre, up to 1.5 at the widest.
They were an order of magnitude below what the equipment can see. No amount of gain changes that.
Written carelessly, “no anomalies were found at the crack locations” reads to an engineer as a clearance. It is nothing of the sort. It is the expected result, and reporting it without that context would have been misleading on a public water asset.
What radar can resolve is the consequence of cracking, meaning delamination, voiding, and moisture-filled horizons. So that is what we looked for, and that is how the report was framed.
- Reinforcement configuration and cover, quantified and cross-checked
- Two subsurface anomalies identified, one characterised by polarity
- A clean control proving the anomalies were real, not artefacts
- The mechanism of the cracking, which is an engineering determination
- Whether the cracks are active, which needs monitoring across a fill cycle
- Crack depth, which needs ultrasonic pulse echo rather than radar
A decision-ready pathway, not a verdict
The engineer received a quantified baseline of the structure, two identified anomalies with the evidence behind them, an explicit statement of what remained undetermined, and a costed sequence for resolving it.
A suspected air-filled plane is confirmed or eliminated with a hammer and twenty minutes. It was the highest-value action available and it required no equipment at all.
Offset across a crack is the single fastest escalation trigger in the classification matrix, and a straightedge answers it.
For crack depth and delamination extent, which radar cannot determine at any setting.
Half-cell potential mapping needs damp concrete for continuity. Drained and still wet was the ideal moment, and that moment closes as the structure dries.
Precision about our own limits is what makes the numbers we do give worth trusting.
Subsurface answers you can put in front of an engineer
Ground penetrating radar, concrete scanning, utility locating, and structural diagnostics across South-East Queensland. If you have a structure that isn’t behaving and no records to explain it, we’re a sensible first call.
Talk to our team →