Calculating Post-Tension Cable Drape using Ground Penetrating Radar
Profiling post-tensioned tendons across two occupied office floors of a Brisbane CBD tower. Eight tendon runs, 478 cover readings, and one question from the engineer: do the tendons sit where the design says they sit?
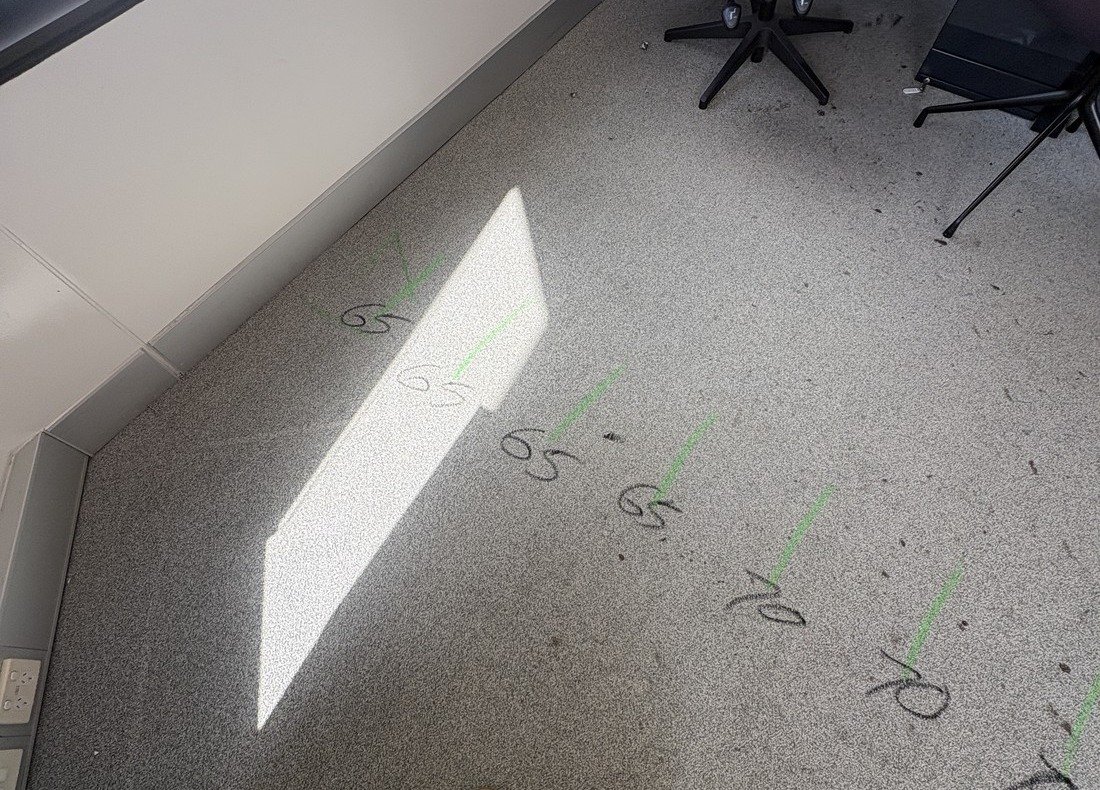
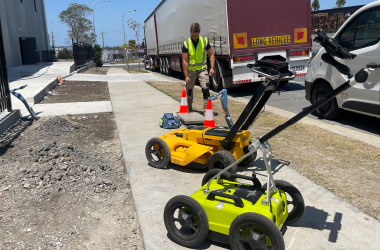
Tendon positions marked on the floor surface, with the cover recorded at each position noted alongside the mark.
Where the tendon runs in plan is only half the answer
A structural investigation was underway into floor deflection observed on Level 17 of a multi-storey commercial tower in the Brisbane CBD. The slabs on the affected levels are documented as 230mm thick post-tensioned slabs at 35 MPa, with tendons of four 15.2mm low-relaxation strands in flat duct.
The engineer's investigation drawing asked a specific question: do the post-tensioning tendons sit where the design says they sit?
Marking a tendon on a floor tells you where the strand runs in plan. It says nothing about the drape.
The drape is the vertical profile the tendon follows as it rises over the supports and falls at mid-span. It is what makes a post-tensioned slab work, and a departure from it changes the behaviour of the floor.
We were engaged to locate the tendons on two levels, then record cover along each nominated run at close intervals, so the recorded profile could be compared against the documented one.
A working office, fully fitted out
Levels 16 and 17 were occupied and in active use as open plan office accommodation. Workstations, screens, storage units, glazed offices and kitchen joinery were in place throughout, with carpet tile over the office areas and ceramic tile through the bathrooms.
That created three constraints, and each one was handled openly rather than quietly absorbed.
Readings could not be taken at true 300mm centres in all locations.
The antenna travelled over carpet and tile, not bare concrete.
Recorded chainage along each run could not yet be tied to span geometry.
Find the tendon first, then walk it end to end
Transverse passes were run across each tendon band to establish the plan position of the individual tendons, which were then marked on the floor. Cover was recorded along each nominated tendon at nominal 300mm intervals, starting at the northernmost point and working north to south, with a dielectric constant of 9.1 applied on site.
A 20mm allowance was deducted for the floor covering, so every cover value in the report is referenced to the top of the concrete rather than the surface the antenna travelled over. Where access was obstructed, the break was recorded as a break. Nothing was interpolated across it.
A drape needs about 150mm of movement. None of the runs showed it.
The drawings put the tendon high over the supports and low at mid-span. Along every run we recorded, the cover stayed approximately constant.
Cover over the supports, 185mm above the soffit.
Cover at mid-span, 35mm above the soffit.
Along any single run. Cover ranged 15 to 120mm across the whole dataset.
Schematic only, not to scale. Support positions are indicative, as gridlines were not surveyed.
One drawing convention, readable in seconds
The raw dataset alone would not have answered the engineer's question. Every run was plotted as a longitudinal drape section: the slab in cross-section, the recorded cover along the run, and the cover positions the documented high and low points would occupy. Breaks in the data are shown hatched, and the vertical exaggeration is stated on each figure.
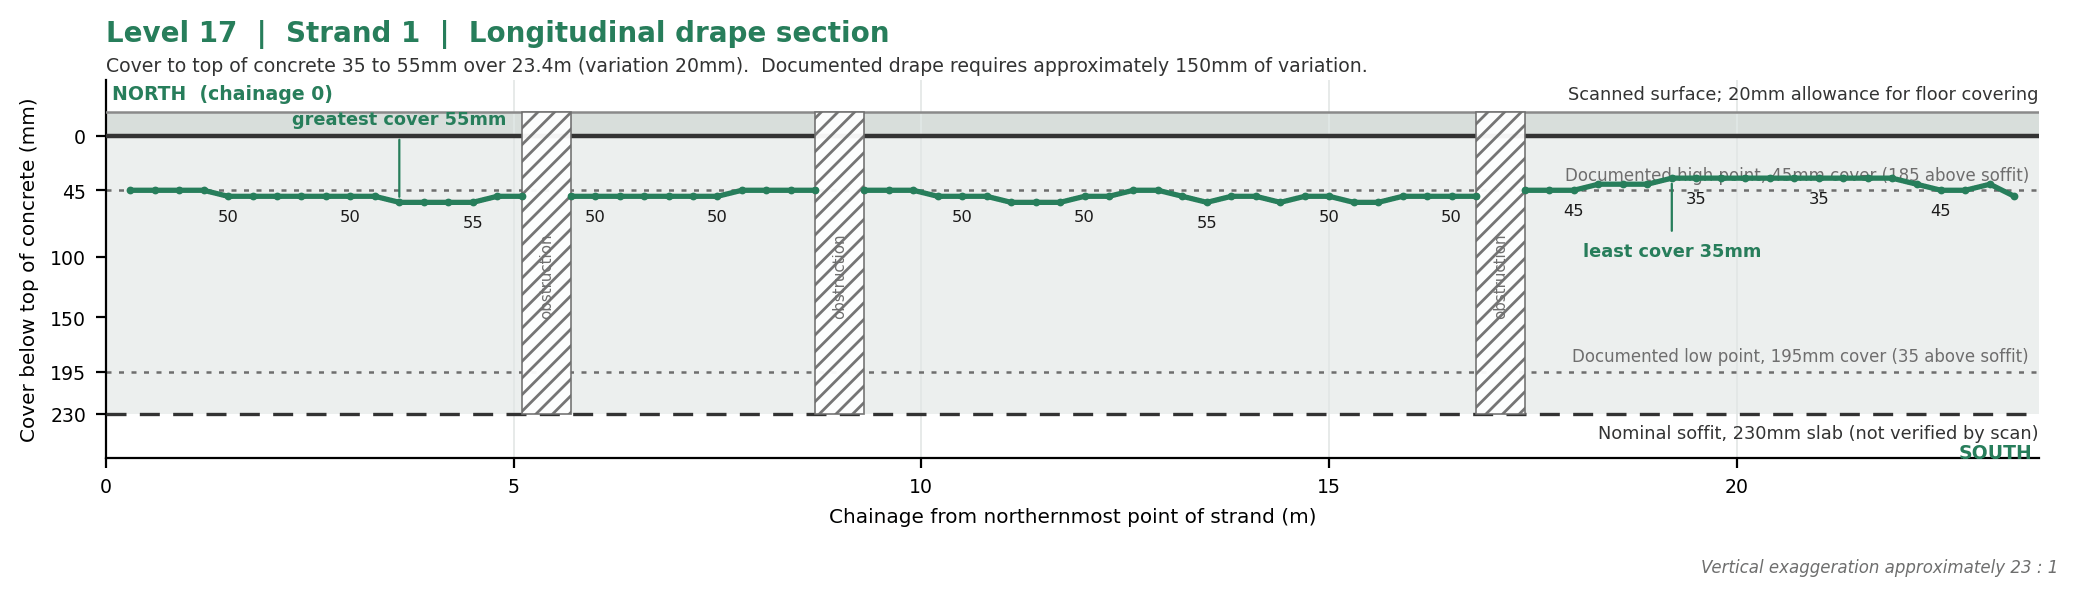
Level 17, strand 1. 75 readings over 23.4m. Recorded cover 35 to 55mm, against documented high and low points of 45mm and 195mm.
That single convention turns 478 numbers into an answer an engineer can read at a glance.
Alongside the sections, the report issued the complete tabulated dataset at every chainage, a summary table of all eight runs, a photographic record of the marking as applied on site, and marked-up plan sheets recording the strand numbering and scan direction.
Constant cover where the design calls for a curve
Across all eight runs, cover to the detected tendon remained approximately constant along the full length recorded. Measured cover to the top of concrete ranged between 15mm and 120mm across the dataset, with variation along any individual run of between 20mm and 80mm.
The documented drape requires roughly 150mm of variation along each run. No profile of that character was observed on any run.
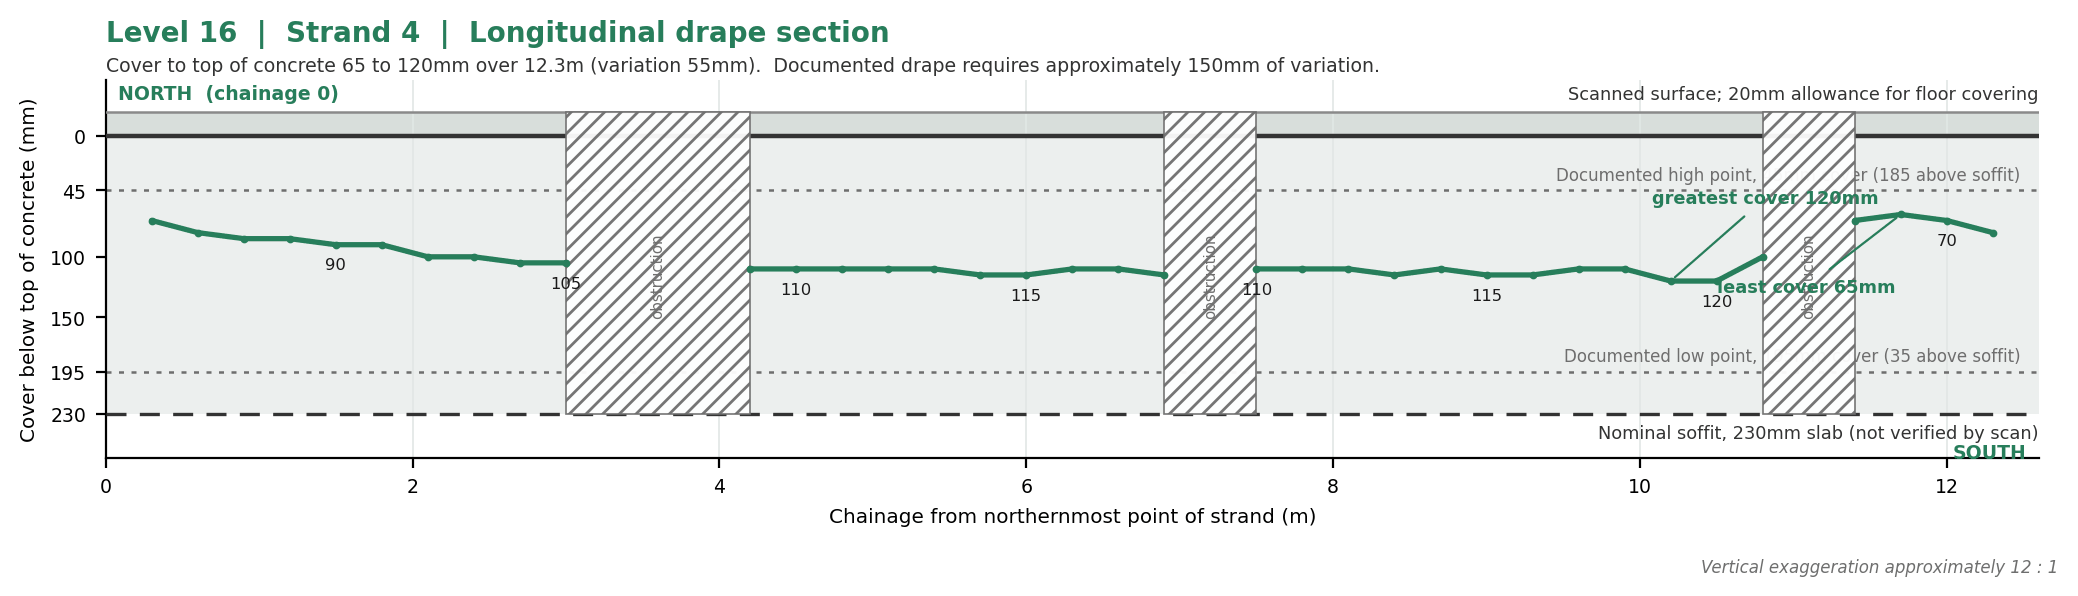
Level 16, strand 4, carrying the greatest cover recorded across the dataset at 120mm.
This is indicative, by observation, of a tendon profile departing from the arrangement documented on the drawings. We offered no opinion on the cause of the departure or its structural significance. The report recommended verification at selected locations by an independent method, and assessment by the project structural engineer, before any conclusion is drawn.
The limitations went in front of the finding, not behind it
An observation like this carries commercial consequences. GPR records the depth to the top of the detected reflector, and recorded depths depend on the velocity calibration applied on site. Each constraint was written into the report, and each generated a specific recommendation for closing it out.
- Plan position of the nominated tendons, marked on site
- 478 cover readings referenced to top of concrete
- Approximately constant cover along all eight runs
- Slab thickness, as the 230mm soffit is taken from drawings, not confirmed by scan
- Floor finish, as one 20mm allowance was applied across both carpet and tile
- Span geometry, as gridlines were not surveyed and chainage is not yet tied to supports
- Cause and structural significance, which sit with the project structural engineer
Verification at the expected mid-span positions was flagged as being of particular value, because that is where the documented drape and the recorded profile diverge most.
A scanning contractor who asserts a defect on the strength of a hand-held antenna is of no use to an engineer. A consultancy that records what it measured, and hands the question to the party qualified to answer it, is a different proposition.
A dataset, a set of drawings, and a clear list of what's next
Eight longitudinal drape sections, one per tendon run.
The full tabulated cover dataset at every chainage on both levels.
Marked-up plan sheets recording strand numbering and scan direction.
A photographic record of all surface marking as applied.
Tendon positions marked ahead of proposed coring works in the bathroom facilities on three levels.
A defined list of outstanding scope, and a request for clarification where the investigation drawing could be read two ways.
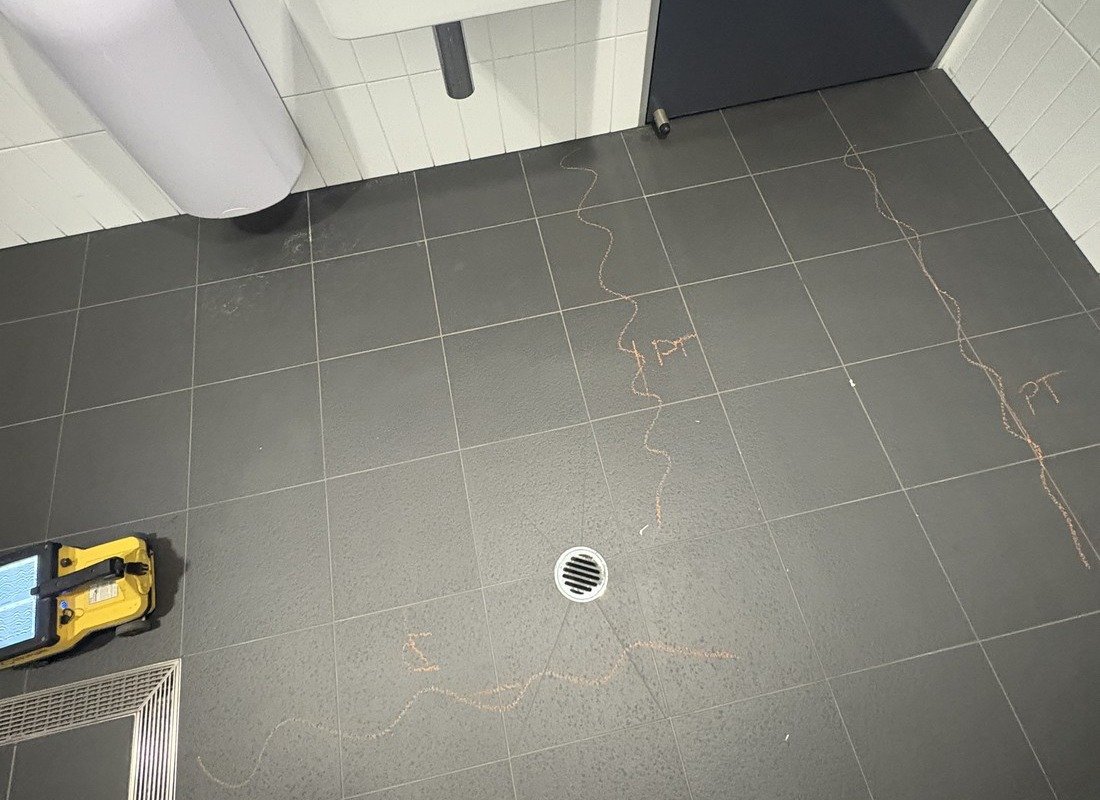
Tendon positions marked on the tiled floor of an accessible shower ahead of proposed coring. IDS C-Thrue antenna at left.
Post-tensioned slab questions, answered with evidence
We're a Queensland-based NDT consultancy specialising in ground penetrating radar, utility locating, concrete scanning and structural diagnostics. We undertake post-tensioned tendon location and drape profiling, reinforcement mapping, slab thickness assessment, void detection and pre-coring scanning, including in occupied and operational buildings.